
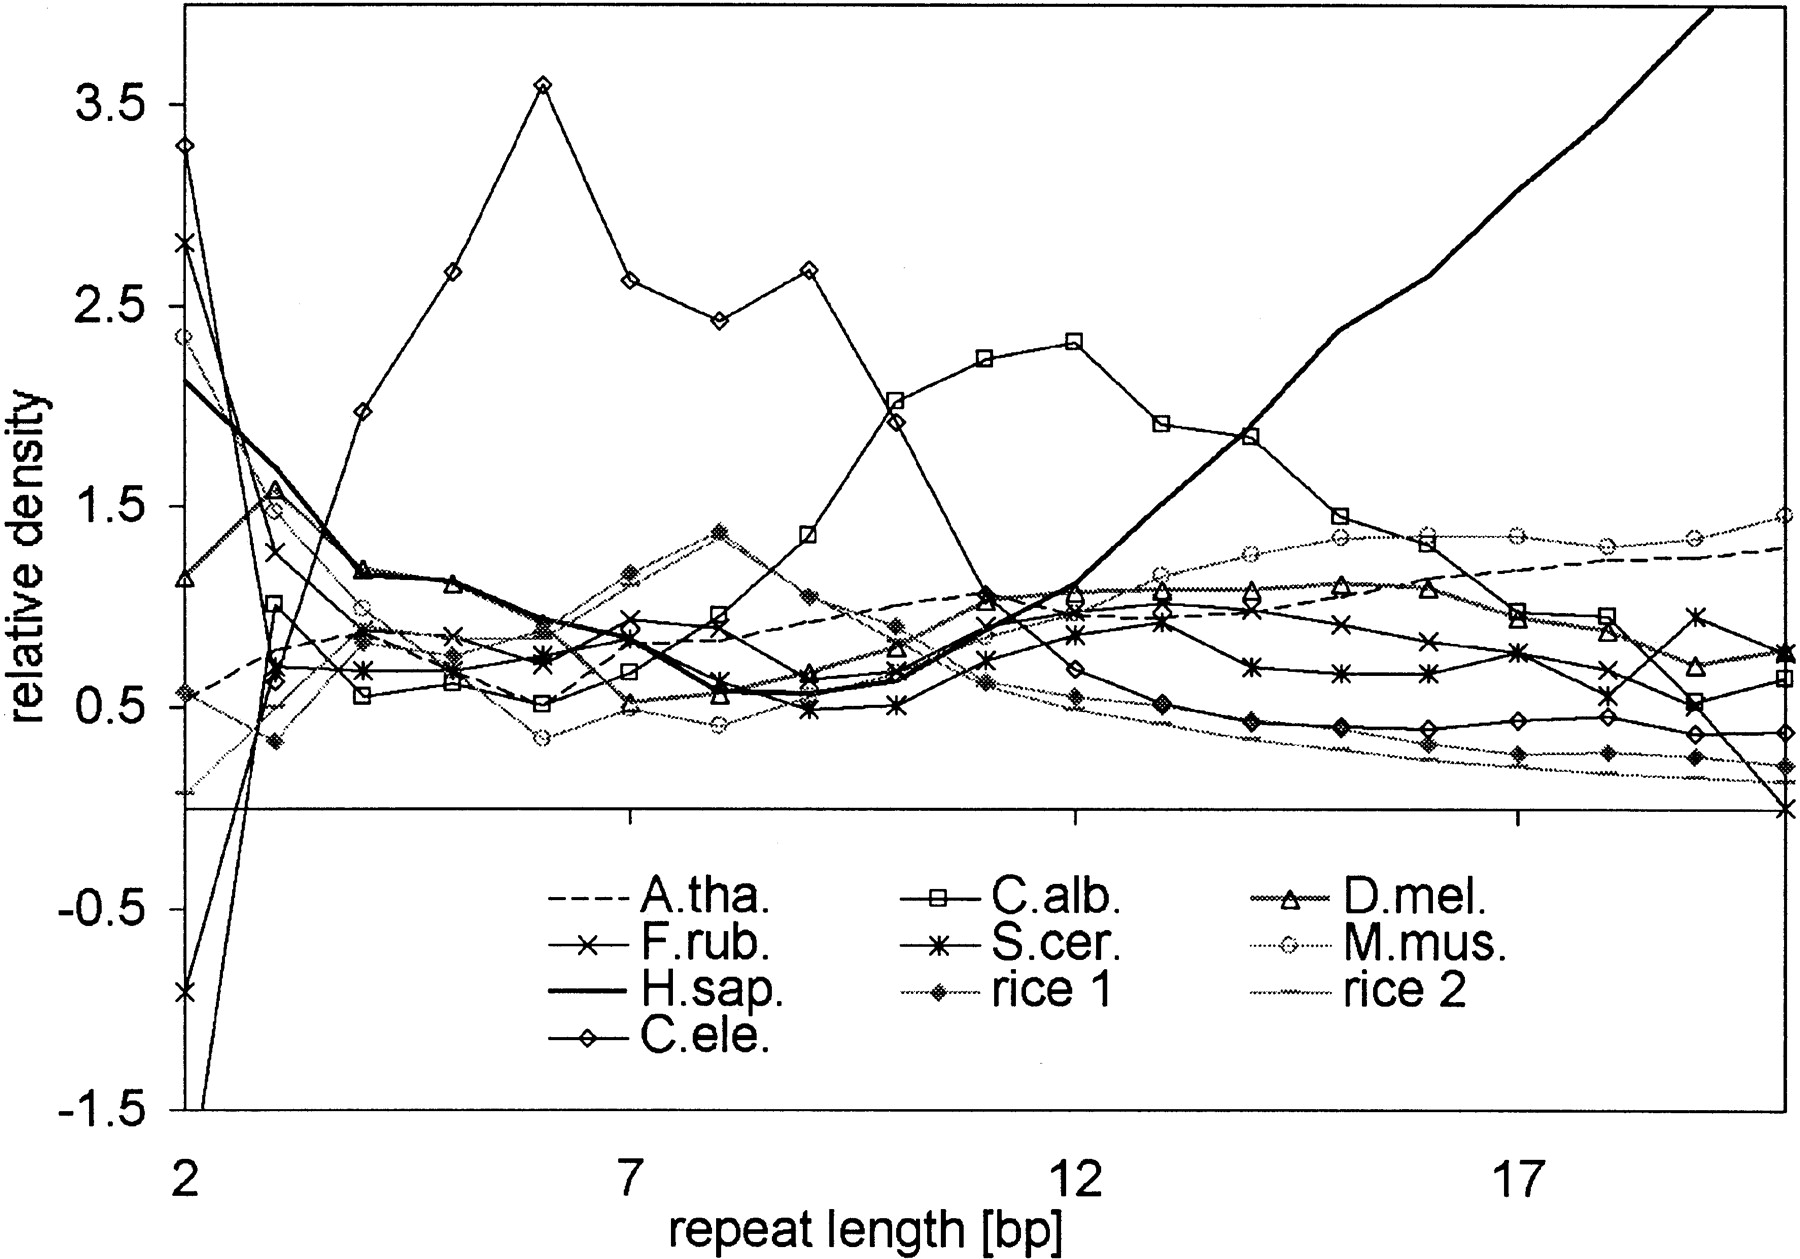
Figure 5
Relative density of mononucleotide microsatellites for all genomes plotted against repeat length. Relative densities were calculated by the comparison of a given species against the mean of all genomes (see text for details).


