
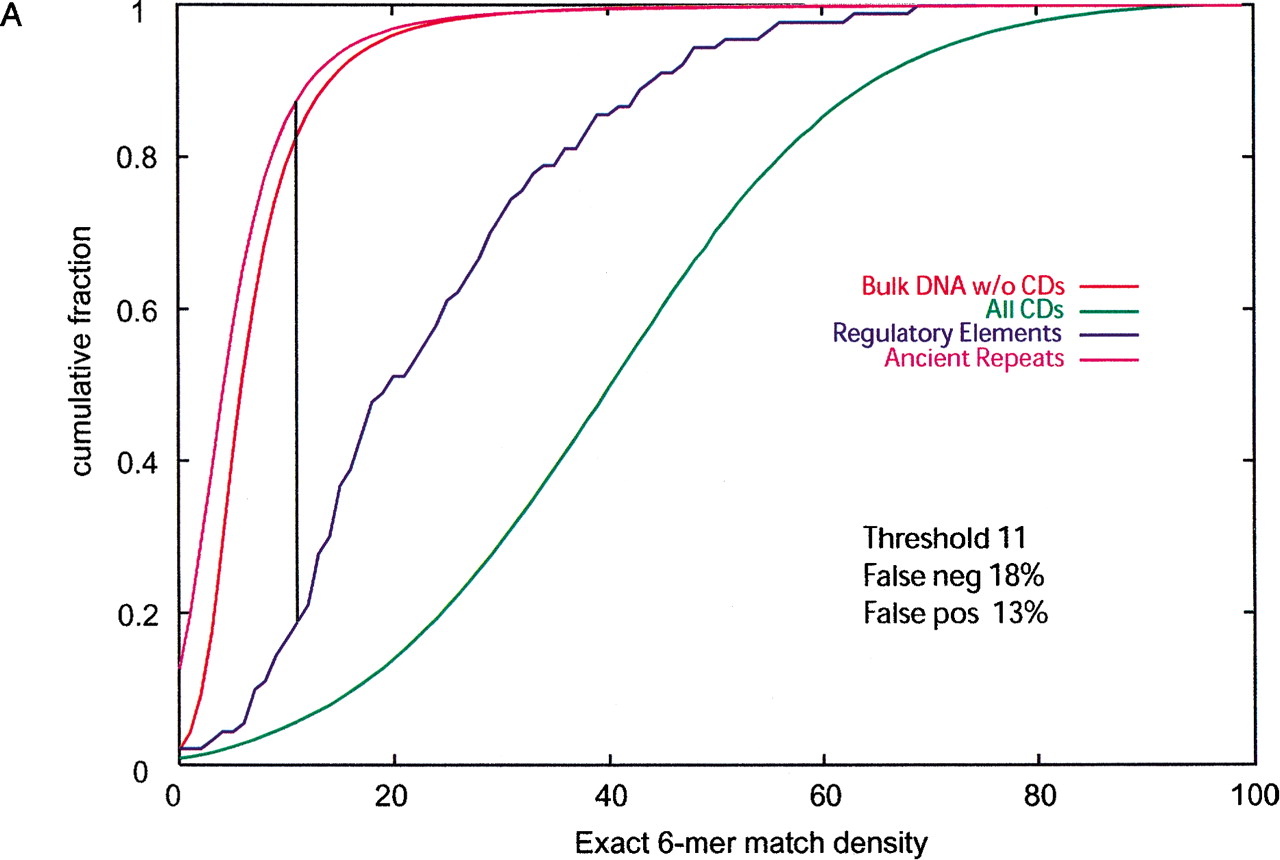
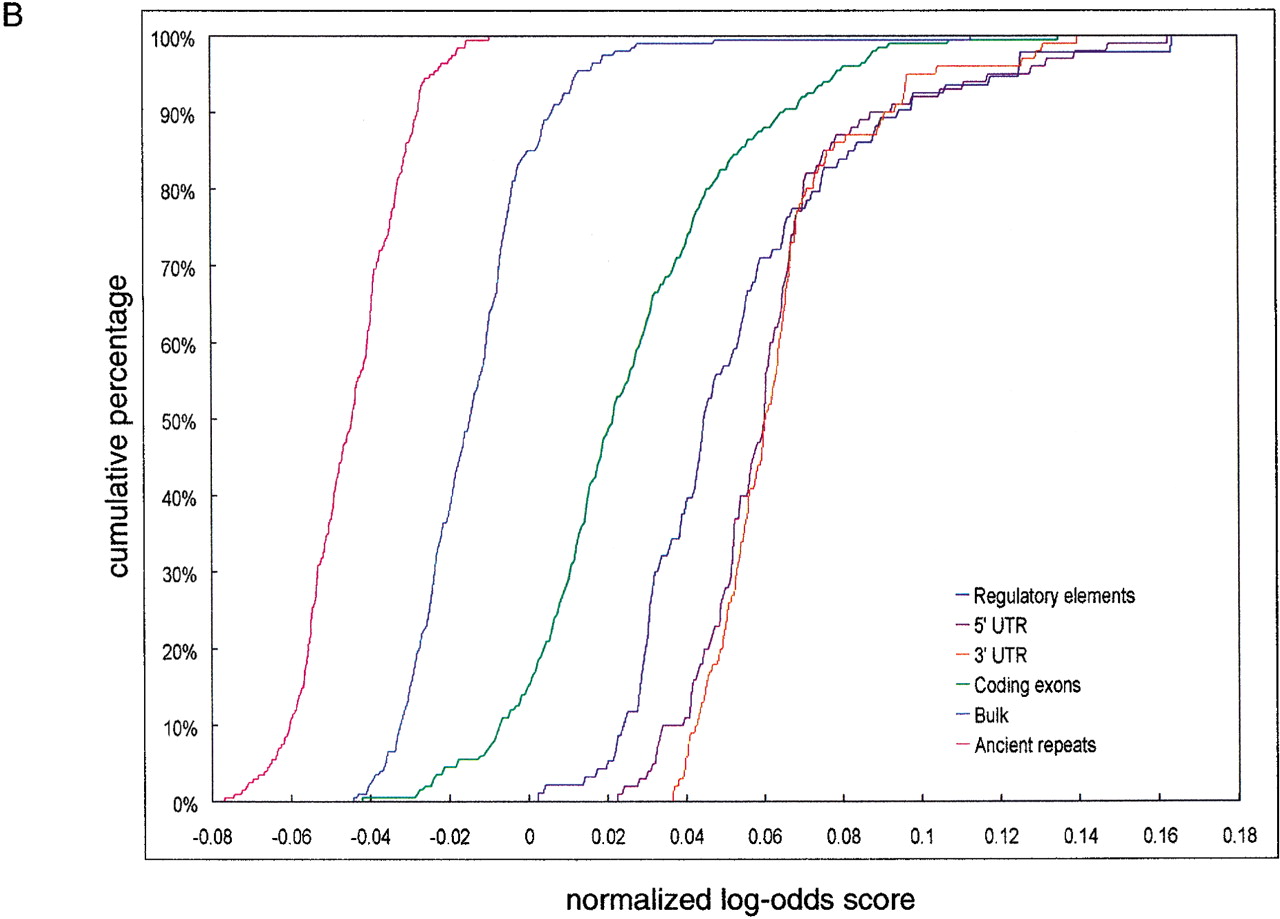
(A) Cumulative distributions of exact hexamer matches density in 200-bp nonoverlapping windows from regulatory elements, ancient repeats, exons, and bulk DNA alignments. The density is calculated by scrolling over 6-nt sequences with no gaps in each window. Vertical line and percentages of false positives (ancient repeats above the threshold) and false negatives (regulatory elements below the threshold) are obtained as for ASPC in Figure 1A. (B) Cumulative distributions of (normalized) log-odds score from fifth-order 5-symbol alphabet Markov Models. The score expression is derived based on 93 regulatory elements and 200 alignment segments of size 200 bp randomly selected from ancient repeats. The cumulative distributions for these are shown in dark blue and magenta, respectively. Because the distributions do not intersect, any threshold between the maximum score value for ancient repeats and the minimum score value for regulatory elements guarantees 0% false positives and 0% false negatives. The green, orange, purple, and bright blue cumulative distributions are obtained applying the score expression to segments from coding regions, UTRs, and bulk DNA.


