
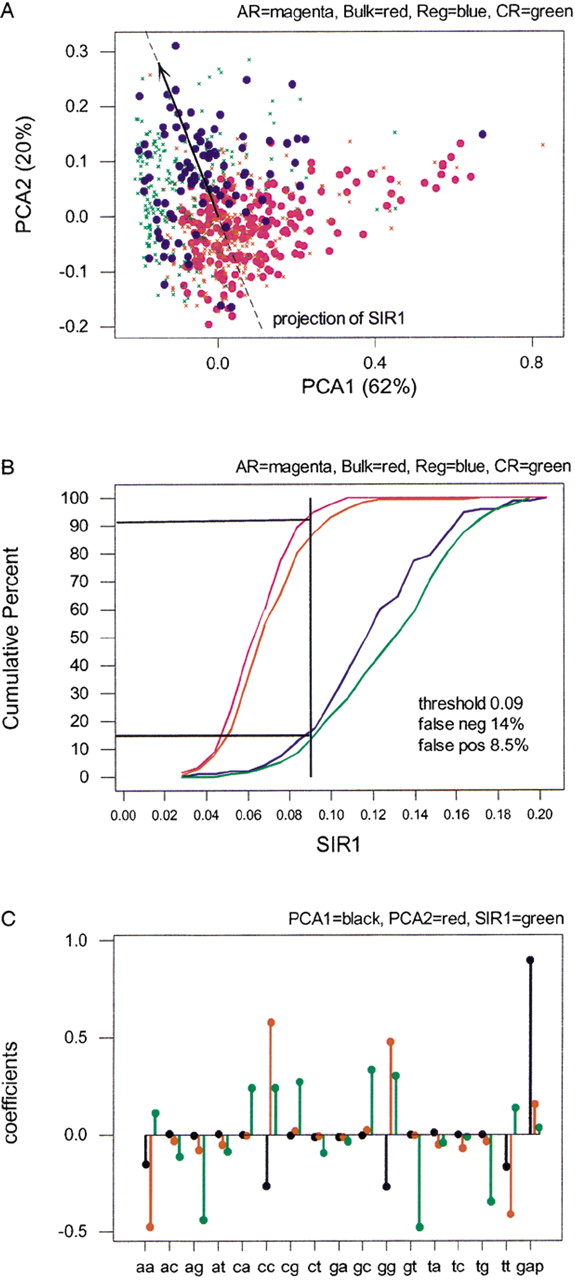
First principal plane projection for frequencies on a 17-symbol alphabet comprising all A, C, G, Tpairings plus an additional symbol for gaps. The data cloud contains 93 regulatory elements (Reg), plus 200 alignment segments of size 200 bp randomly selected from each of ancient repeats (AR), coding exons (CR), and bulk DNA (shown as different marks). Percentages of explained variability are reported for the first and second principal component (total for the plane, 82%). The black line is a projection of SIR1 (see B) on the first principal plane. (B) Cumulative distributions of SIR1 (first Sliced Inverse Regression linear combination) for frequencies on the 17-symbol alphabet. The distributions concern 93 regulatory elements (Reg), plus 200 alignment segments of size 200 bp randomly selected from each of ancient repeats (AR), coding exons (CR), and bulk DNA. The vertical line and percentages of false positives (ancient repeats above the threshold) and false negatives (regulatory elements below the threshold) are obtained as for ASPC in Figure 1A. (C) Coefficients of the linear combinations expressing first (black) and second (red) principal components, and first SIR direction (green). These are eigenvectors from spectral decompositions of appropriate variance/covariance matrices (see Methods and Table 1). Thus, each has norm 1 vector (the squares of the coefficients add up to 1), and PCA1 and PCA2, which come from the same decomposition, are orthogonal (the cross products add up to 0).


