
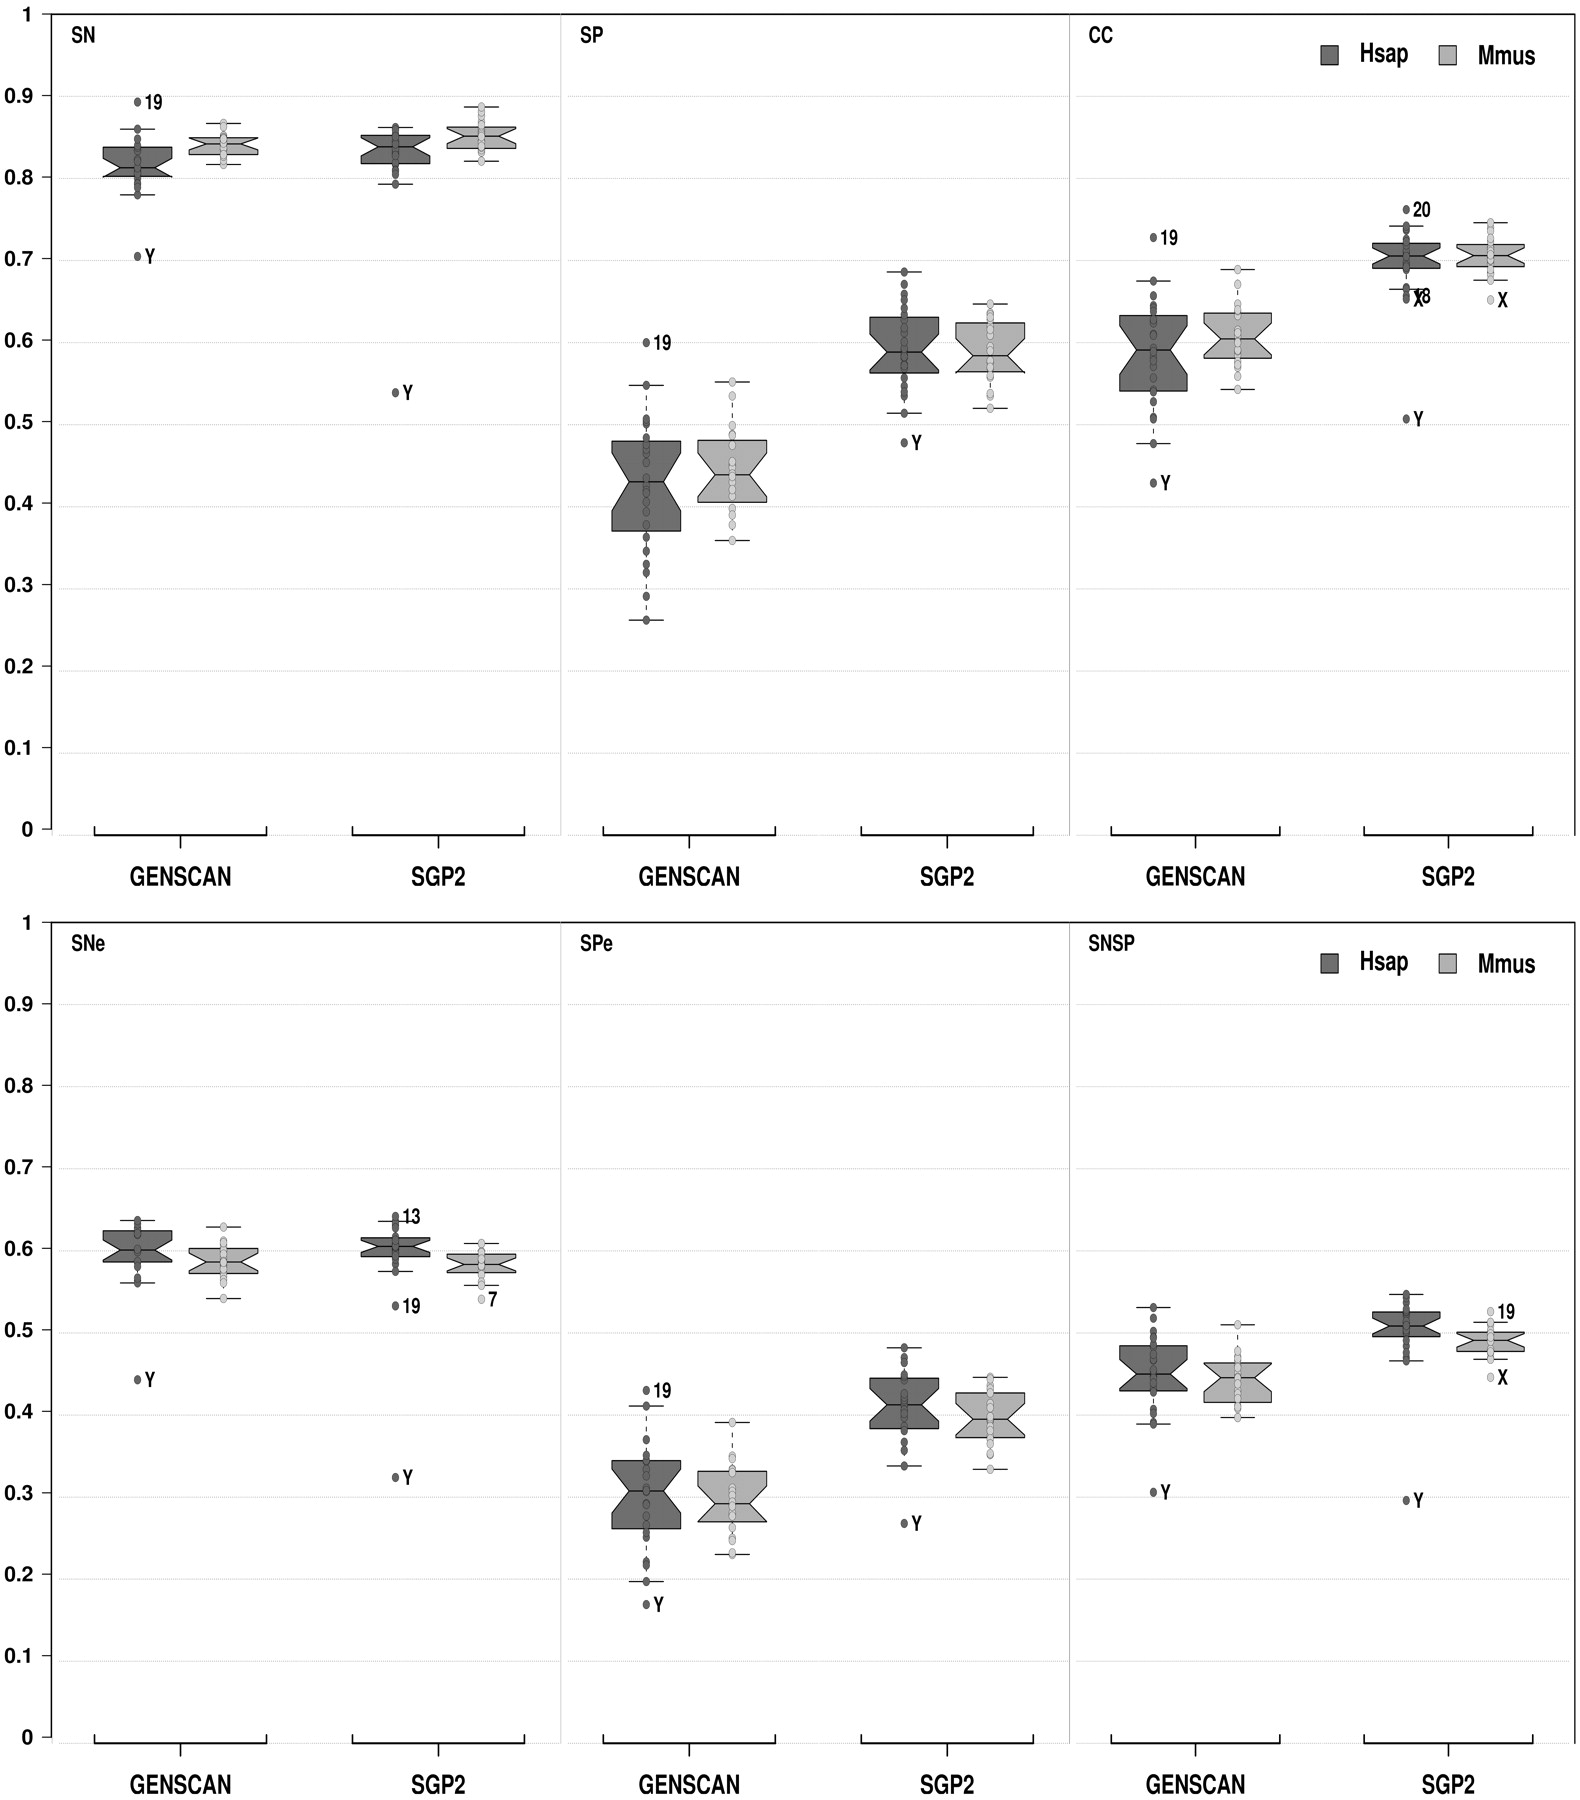
Figure 3.
Accuracy of the human and mouse SGP2 and GENSCAN predictions. The accuracy was measured in the entire chromosome sequences using the standard accuracy measures: SN, (sensitivity); SP, (specificity); CC, (correlation coefficient); SNe, (exon sensitivity); SPe, (exon specificity); and SNSP, (average of sensitivity and specificity at exon level). Predictions from both programs were compared against the human and mouse ENSEMBL annotations. Each dot corresponds to the accuracy measure of one chromosome. Chromosome labels are shown for outlier values. The boxplots (Tukey 1977) were obtained using the R-package (http://cran.r-project.org/).


