
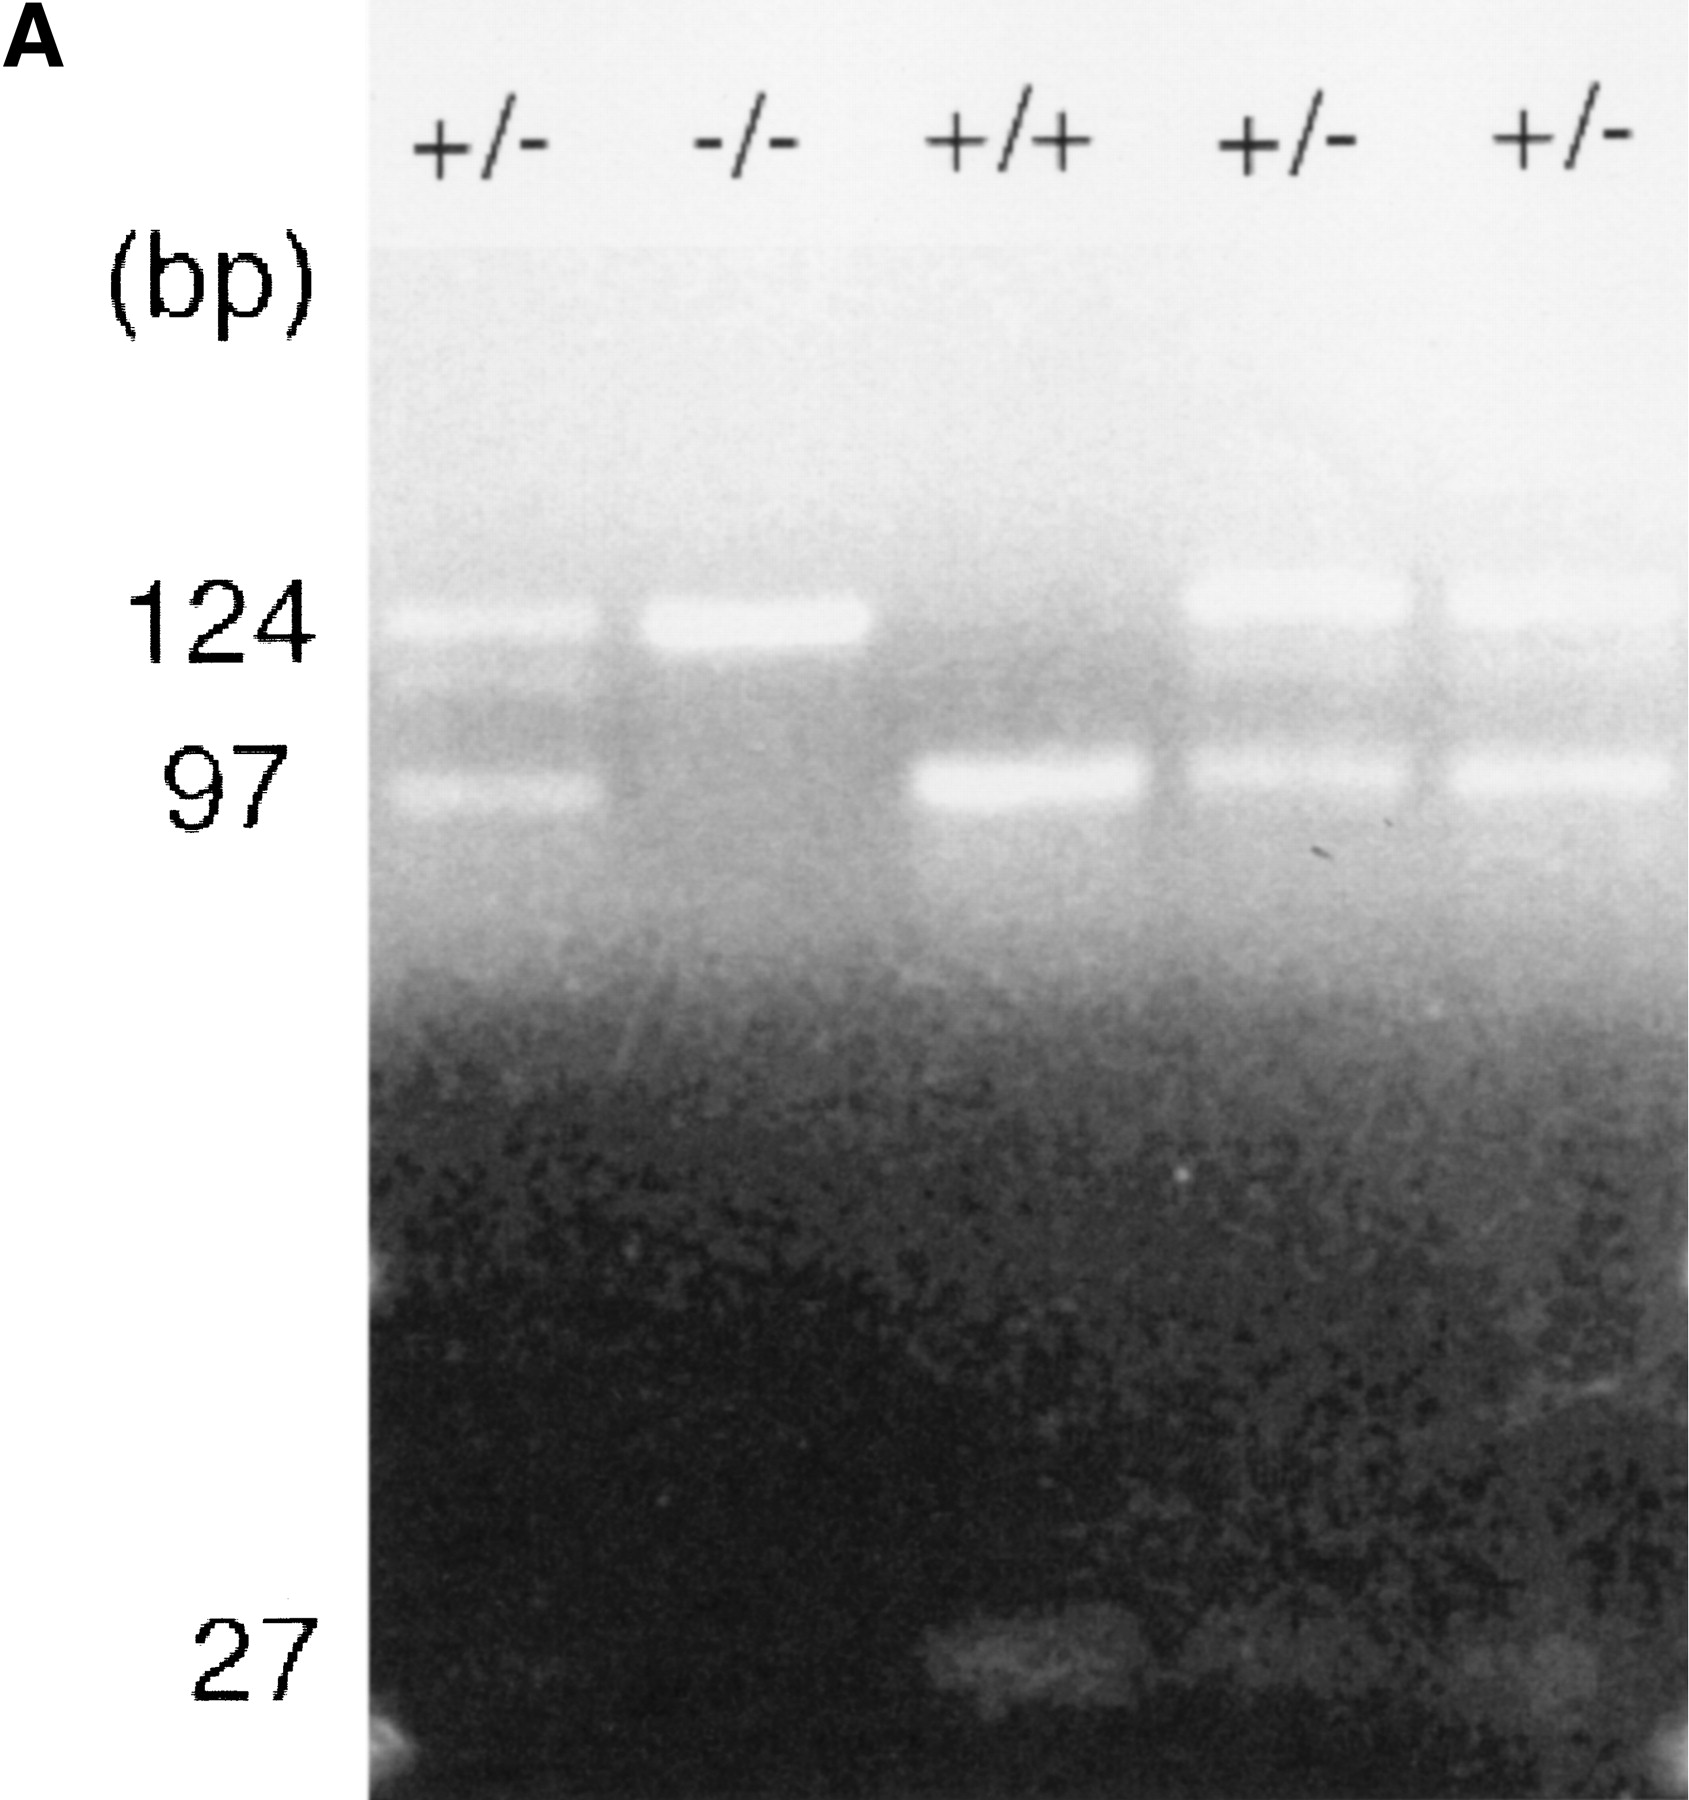
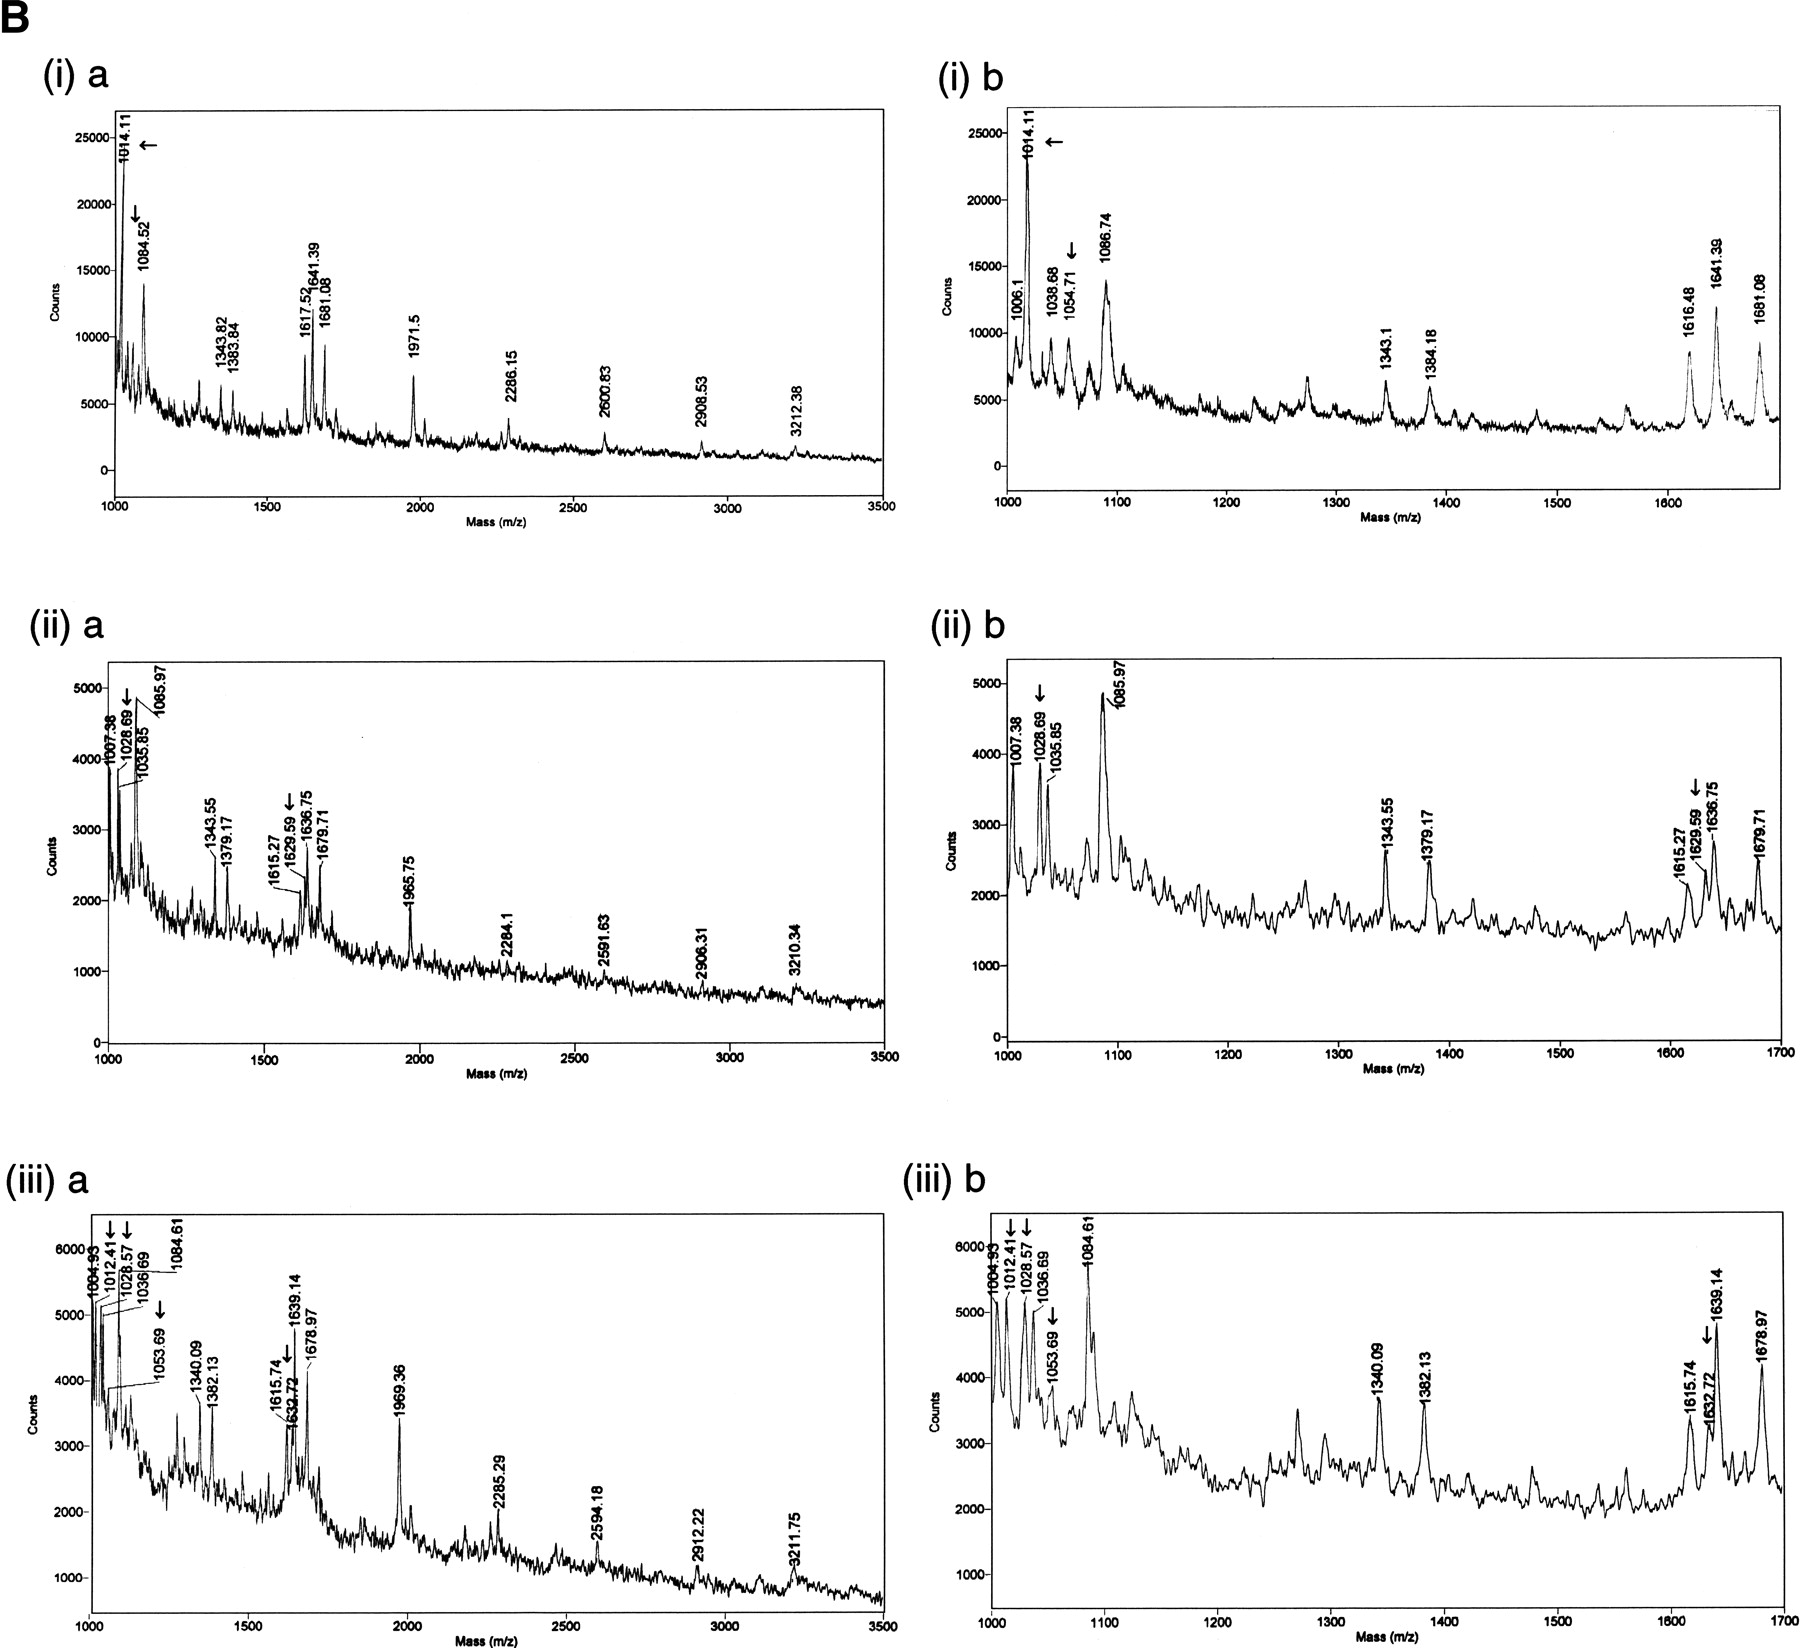
(A) TaqI restriction digest of IL12 polymerase chain reaction (PCR) products from +/− individuals (lanes1,4,5) a +/+ individual (lane 3) and a −/− individual (lane 2). The 124-bp fragment is cleaved by TaqI (when possible) to produce 97- and 27-bp fragments. (B) Linear matrix-assisted laser desorption ionization–time of flight (MALDI-TOF) spectra of cleavage products. (Left) Spectra showing a mass range of 1000 to 3500; (right) same spectra, but in detail, showing the mass range from 1000 to 1700. Spectra ia and ib are from a −/− individual, spectra ii a and iib are from a +/+ individual, and spectra iiia and iiib are from a +/− individual. Observed masses are indicated above peaks. Arrows indicate the peaks that change between the two alleles.


