
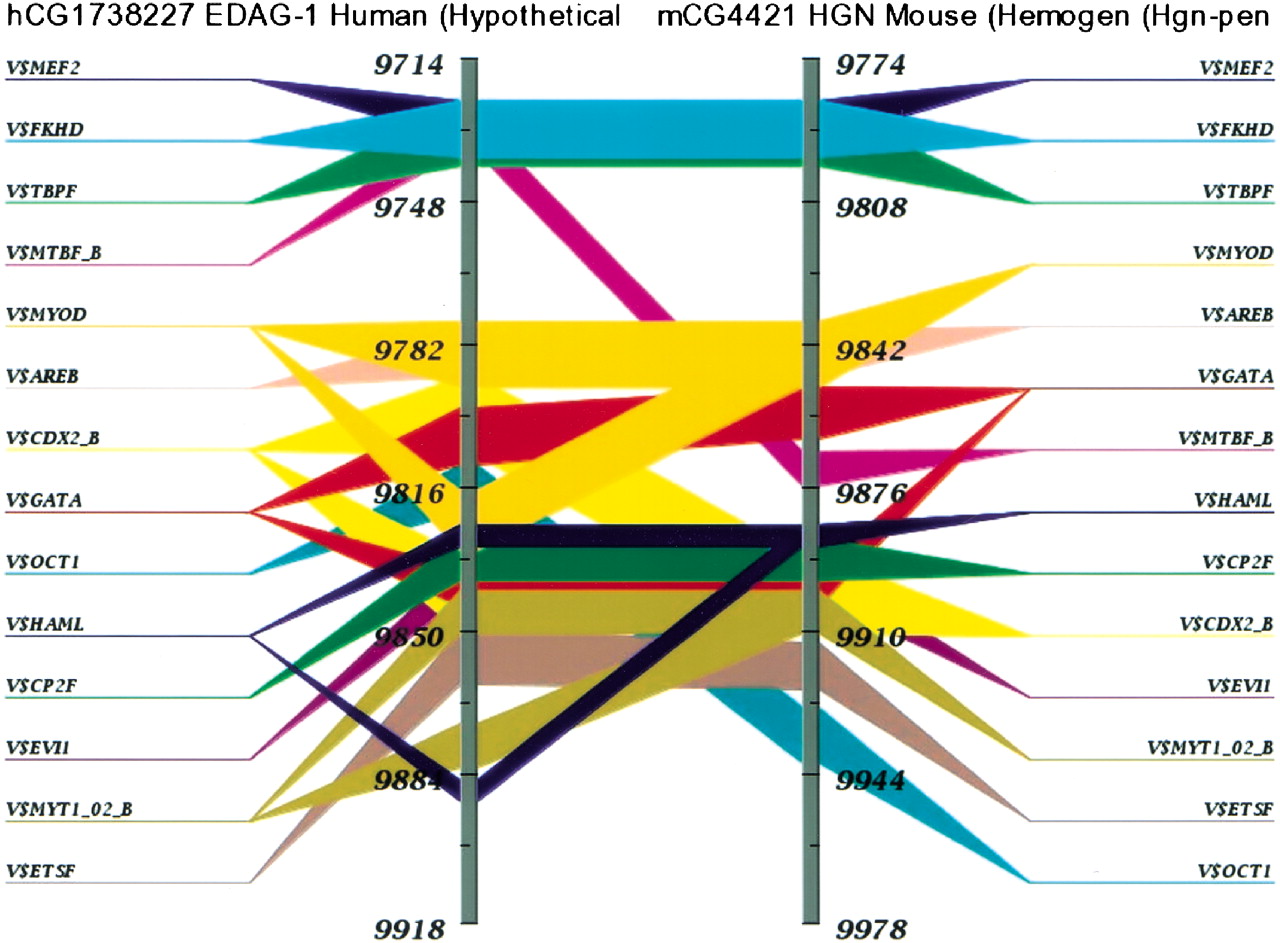
Figure 3.
TraFaC image of the promoter region of mouse hemogen and human homolog,EDAG. This region revealed a strong conservation of consensus TF-binding sites in relatively the same order of occurrence. The two gray vertical bars are the two genes (human EDAG and mouseHGN) that are compared. The numbers represent the nucleotide positions with respect to the sequences used. The TF-binding sites occurring in both the genes are highlighted as various colored bars drawn across the two genes. The image can be clicked to zoom in on a site of interest.


