
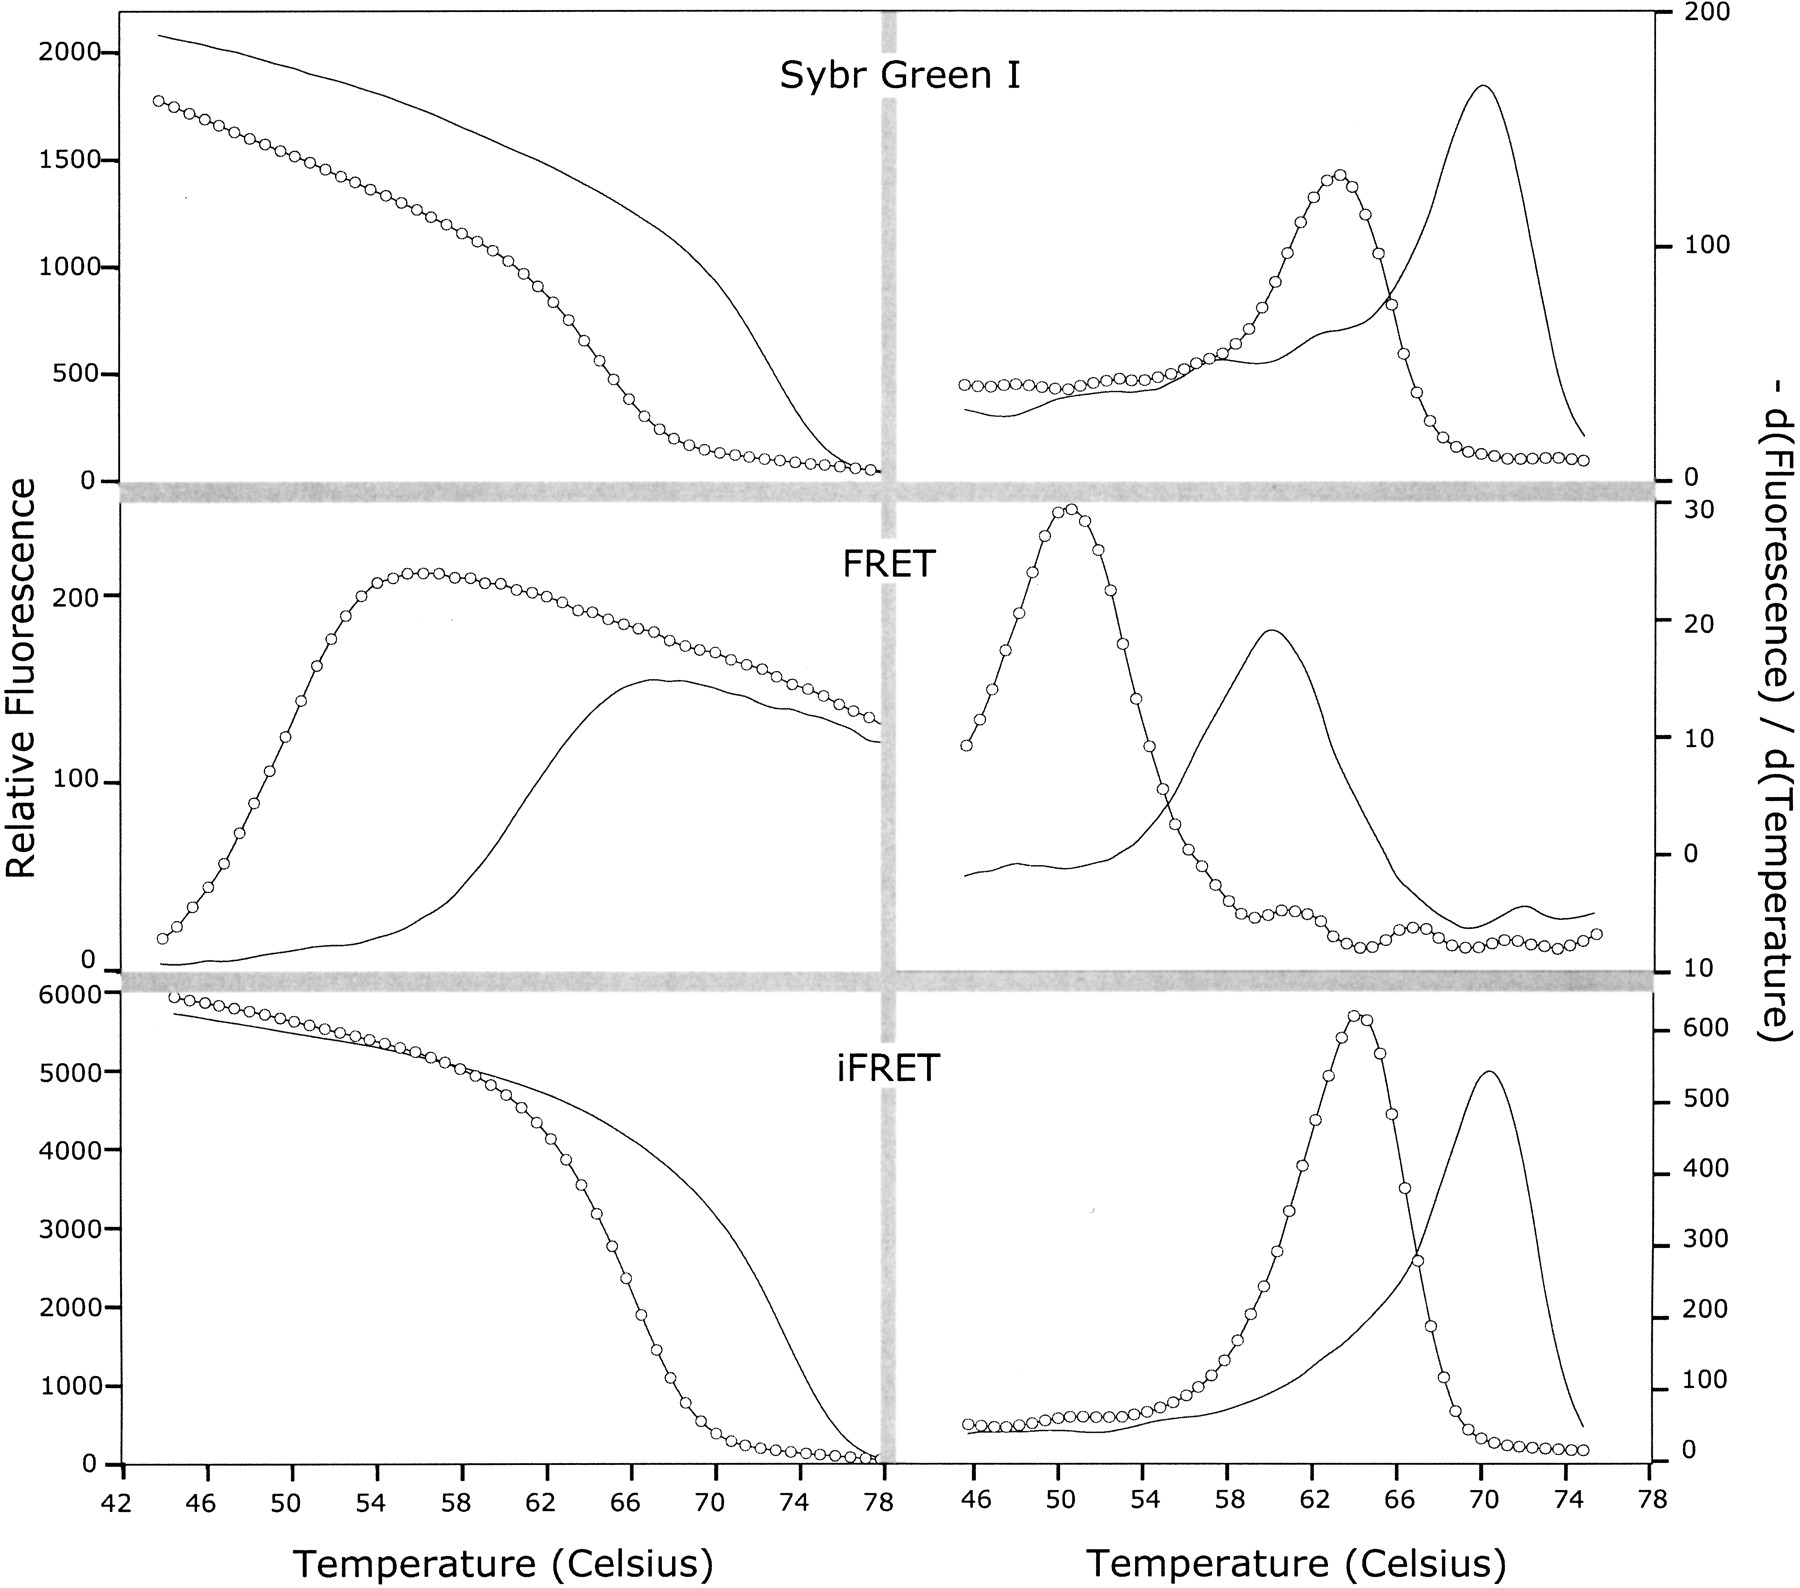
Figure 4.
Melting curves for matched duplexes (solid lines) and single-base mismatch duplexes (hollow circles) are presented. For each indicated detection system, the graph to the left depicts fluorescence versus temperature, and the graph to the right is the derivative versus temperature.


