
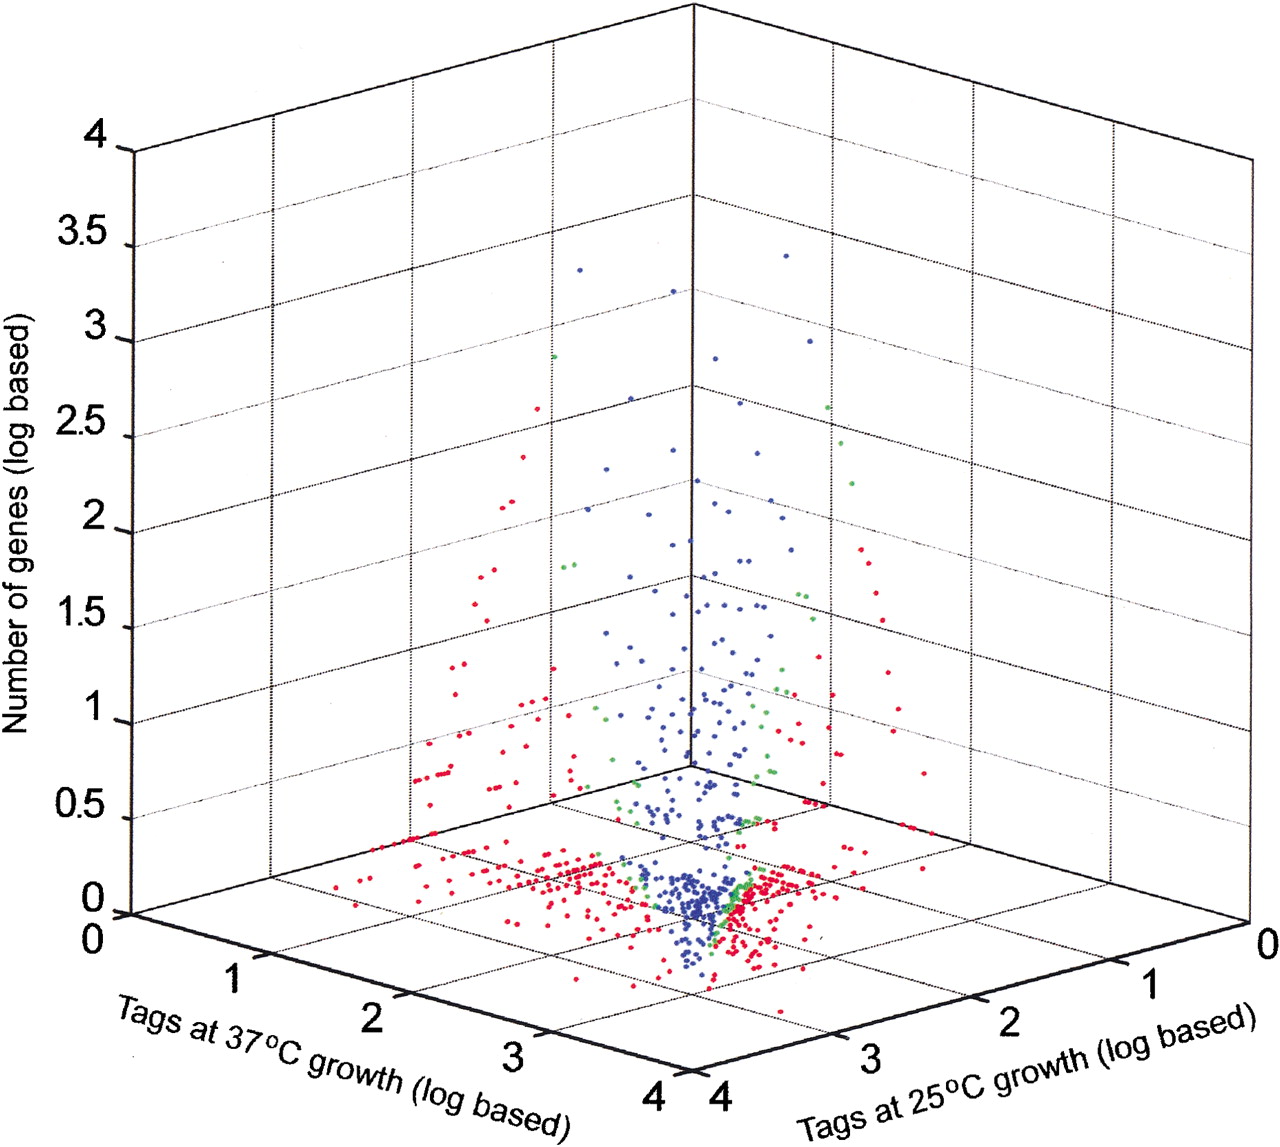
Figure 1.
Expression profile comparing relative transcript levels at 25°C and 37°C in strain H99. Singleton tags were excluded. Blue dots indicate tags that do not show a significant expression difference; green dots, tags with a difference that is significant at 95% to 99% confidence; and red dots, tags with a significance of >99% confidence.


