
Figure 1.
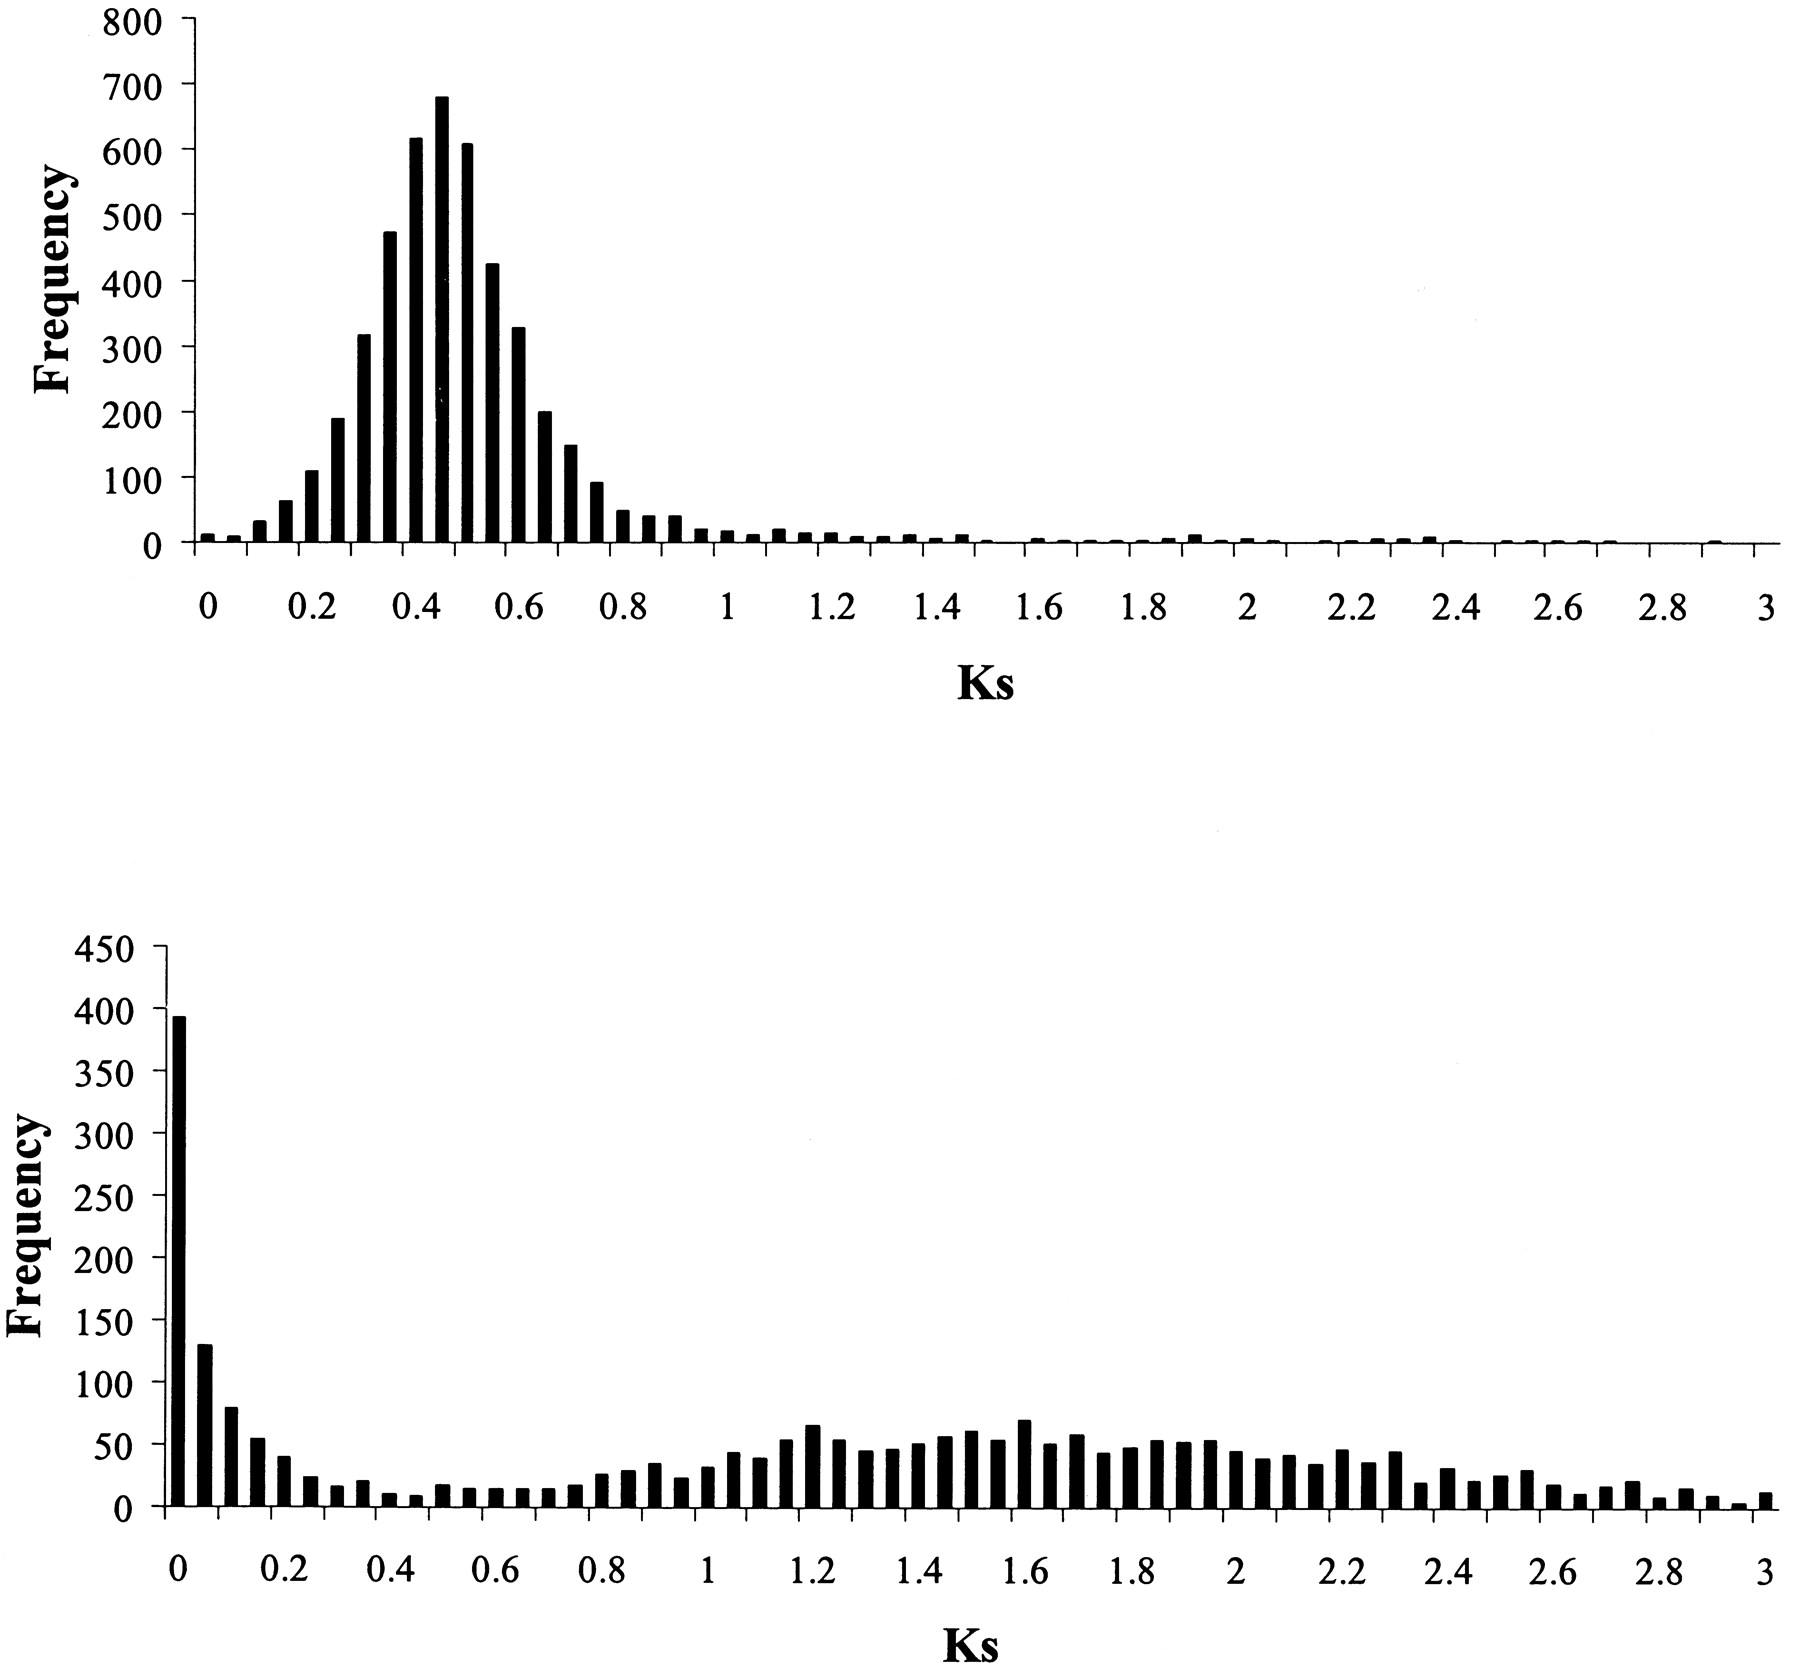
Histogram of KS for human and mouse orthologous gene pairs (A) and for human closest paralog pairs (B).
(Downloading may take up to 30 seconds. If the slide opens in your browser, select File -> Save As to save it.)
Click on image to view larger version.
Histogram of KS for human and mouse orthologous gene pairs (A) and for human closest paralog pairs (B).
 CiteULike
 Delicious
 Digg
Digg Facebook
 Google+
 Reddit
 Twitter
