
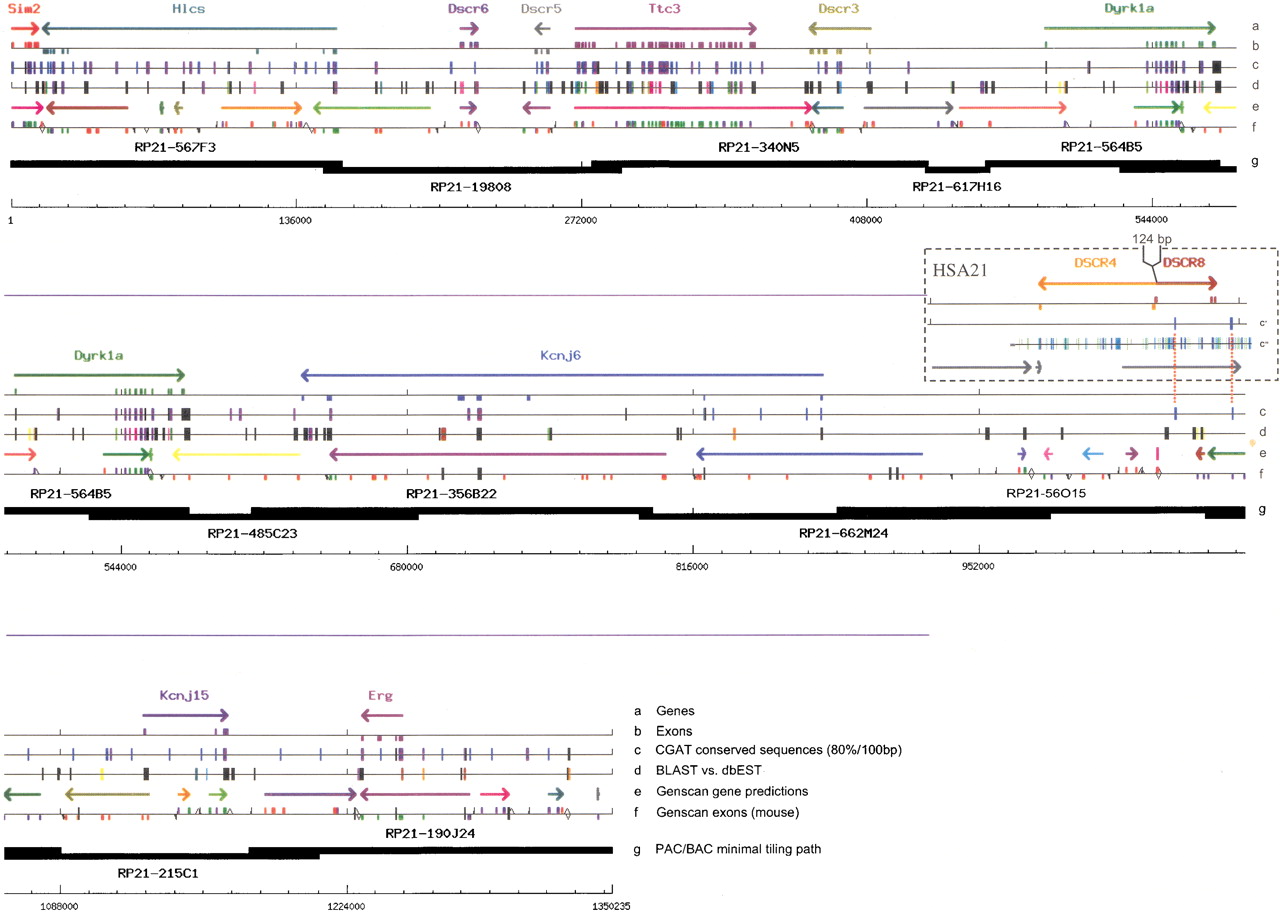
Mouse Down syndrome critical region (DSCR). The CGAT output for 1.3-Mb finished mouse sequence contains 10 known genes (line a) for which exons are indicated (line b). Conserved sequences detected with the CGAT (>80% identity/100-bp window) are indicated (line c), with 80% identity/100 bp shown in light blue and progressively greater identity in darker colors. There is a good, although not comprehensive, correspondence of these sequences with matches from expressed sequence tag and nonredundant databases (lined). Mouse GENSCAN-predicted exons and gene models are also shown (lines e,f). The positions of theDSCR4 and DSCR8 genes and their exons in the corresponding human sequence are shown in the “HSA21” box with a stringent (80%/100-bp window, c‘) and nonstringent (65%/50 bp, c“) in comparison to mouse. The P1-derived artificial chromosomes (PAC) clones forming the minimal tiling path used for sequencing are presented to scale (line g).


