
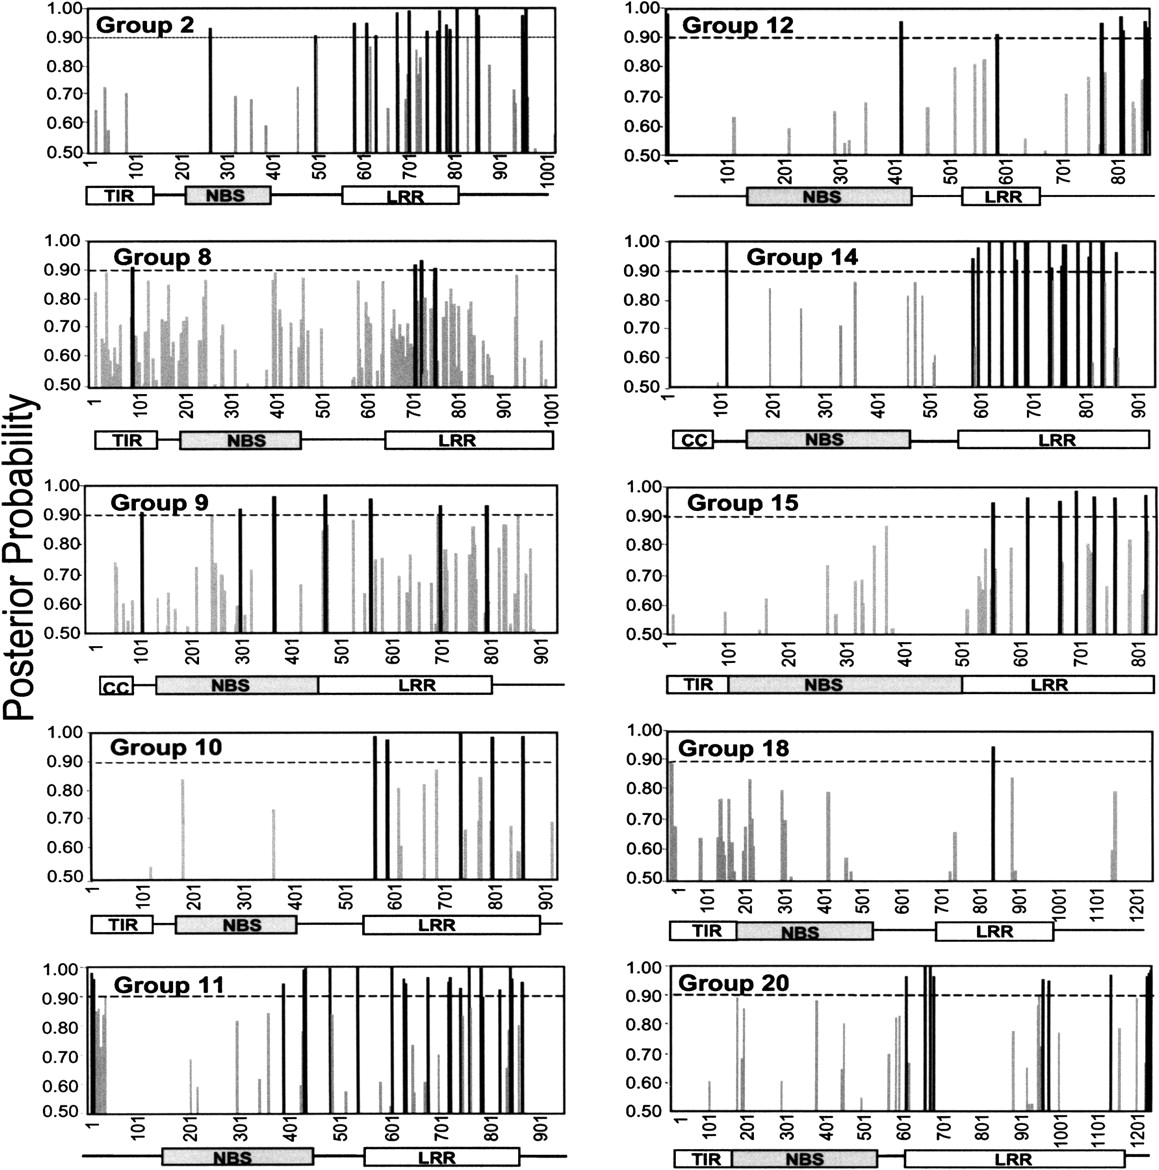
Figure 1.
The posterior probability for sites in the positively selected class (ω > 1). Each graph represents 1 of the 10 sequence groups for which positive selection was detected by comparison of M7 and M8. TheX-axis denotes position in the amino acid alignment. Sites with black bars had a posterior probability >0.9 under M8; sites with gray bars did not have posterior probabilities >0.9. Boxes under each graph denote domain structures of nucleotide sequences in the group, as identified either by Pfam (groups 2, 8, 9, 11, and 12) or by comparison to groups containing previously described R genes (groups 10, 14, 15, 18, and 20).


