
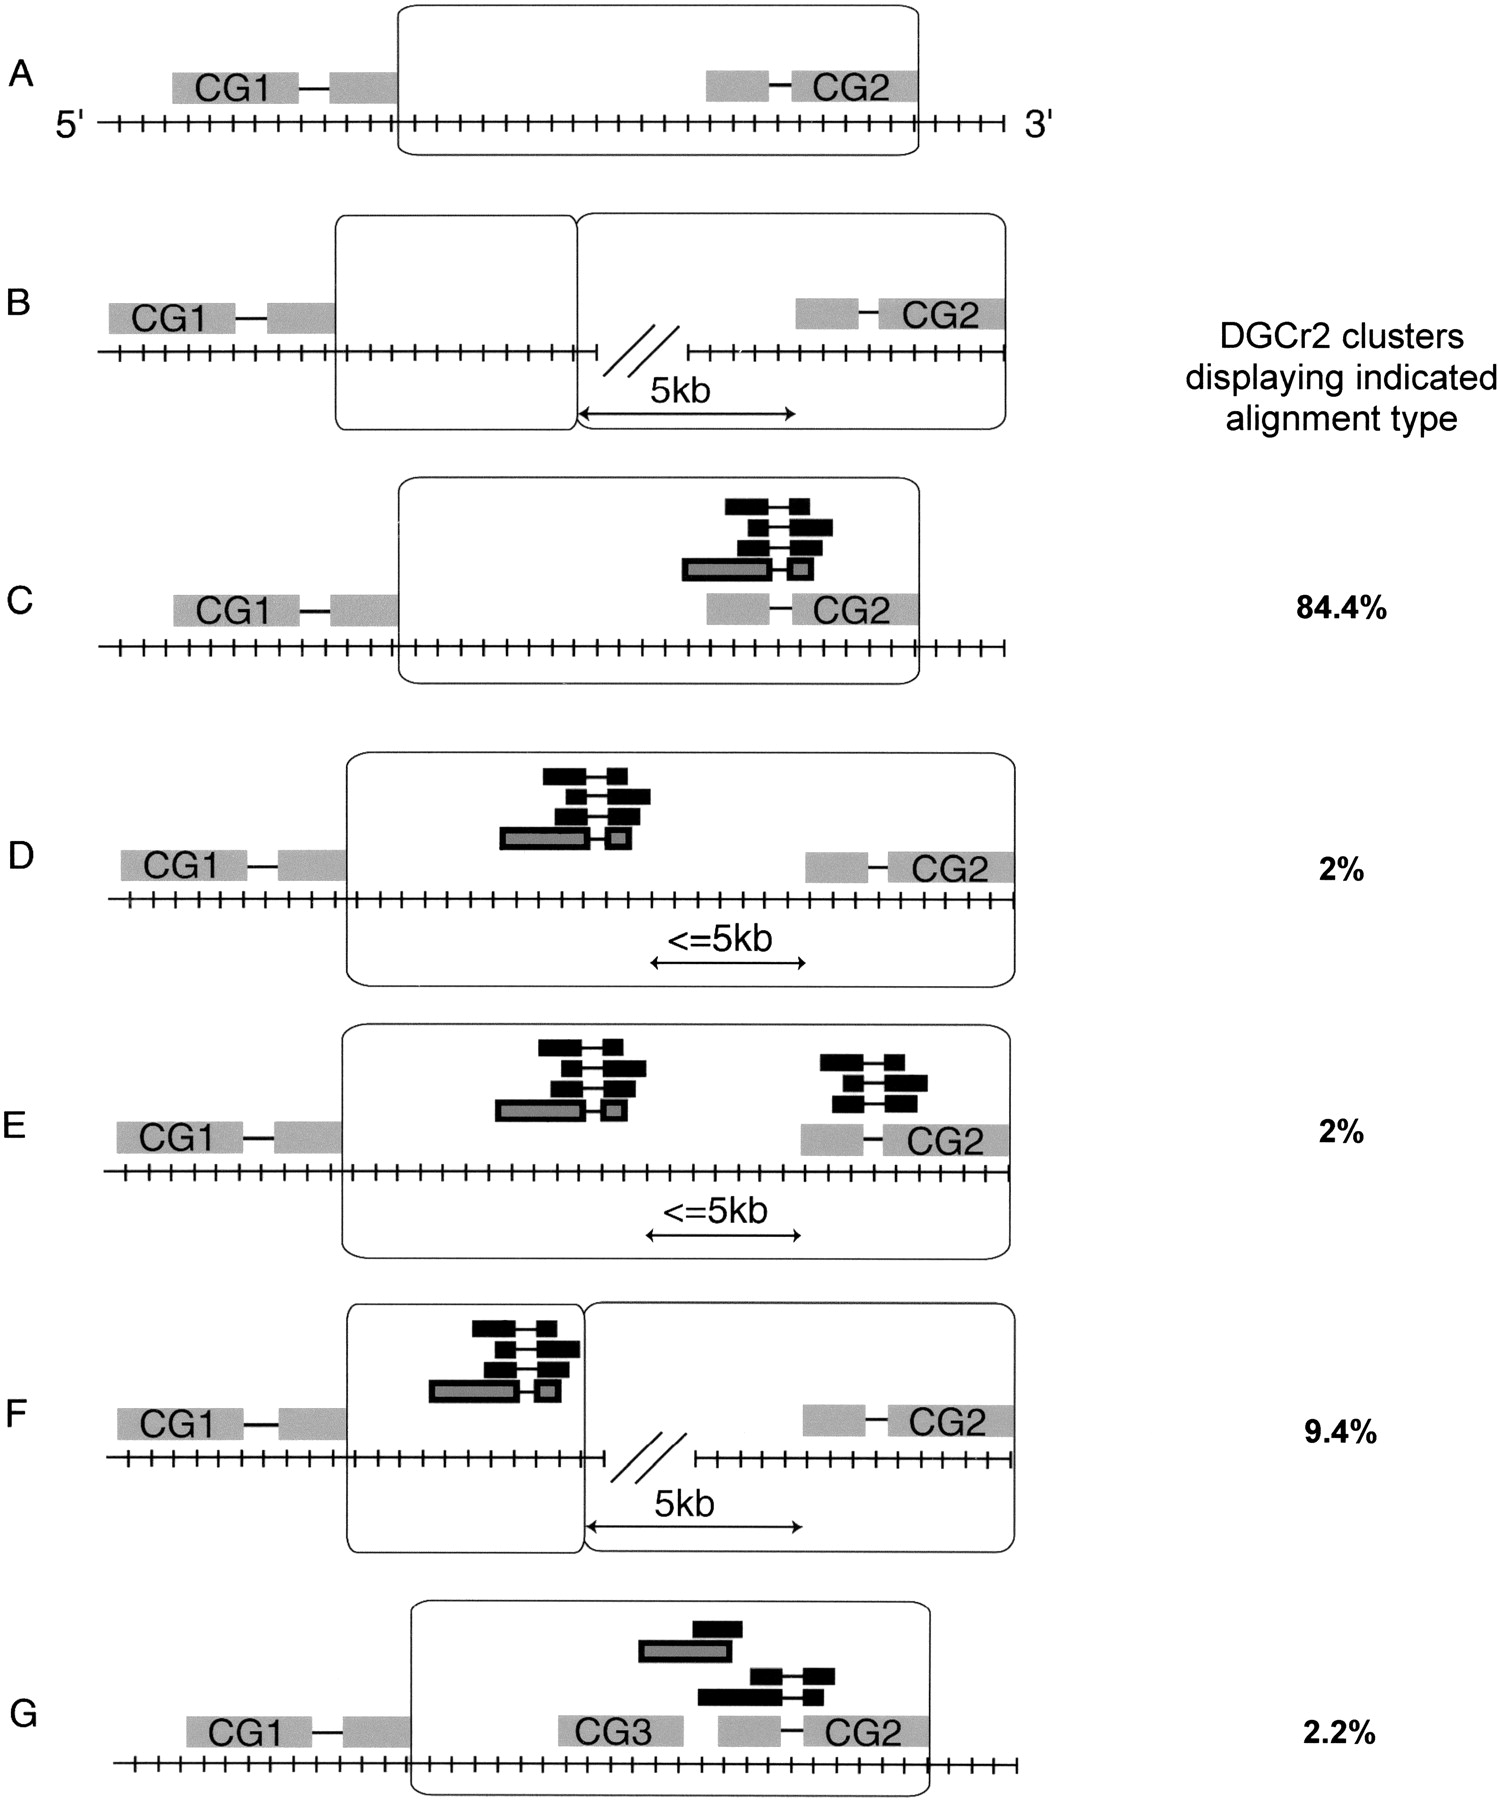
Figure 2.
CG regions. The observed percentage of each alignment type for clusters representing DGCr2 is indicated in the right column. CG regions are represented as open boxes. CGs are shown numbered in gray boxes (exons) connected by lines (introns). The genomic sequence is shown as a hatched line. Aligned EST clusters are shown in black, and the ESTs chosen for DGC2 are gray with a black border. All CGs and alignments are shown representing one strand of the genome proceeding 5′ to 3′ as indicated in (A). See text for a full description of CG regions.


