
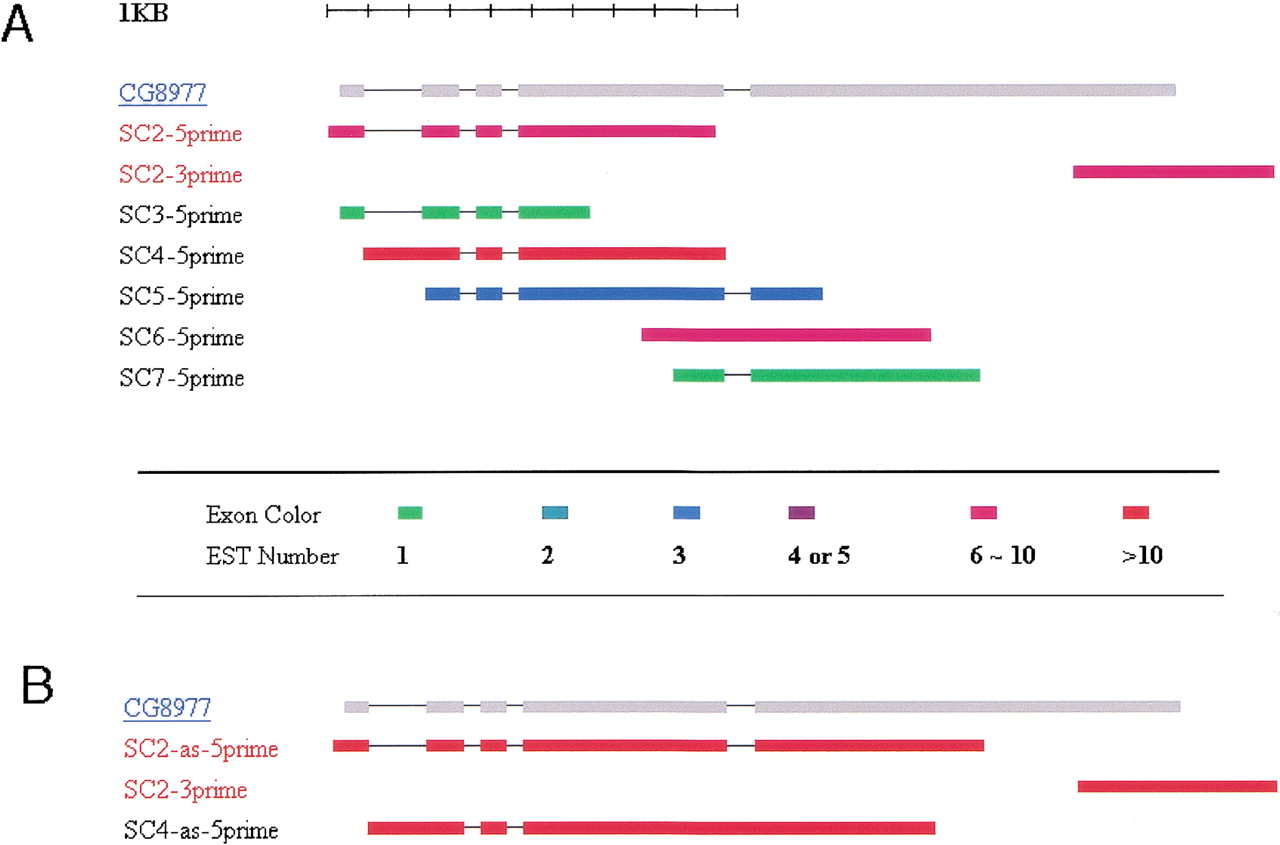
Figure 1.
Graphical display of expressed sequence tag (EST) clusters. (A) is an example of six different subclusters aligning to the Curated Gene CG8977 and numbered SC2-SC7. The subclusters are color coded with respect to the number of EST members as shown. (B) is a gene model based on the merged subclusters illustrating two possible splice variants and numbered SC2-as and SC4-as. SC2-as is a merge of SC2, -3, -5, and -7 and SC4-as is a merge of SC4 and SC6.


