
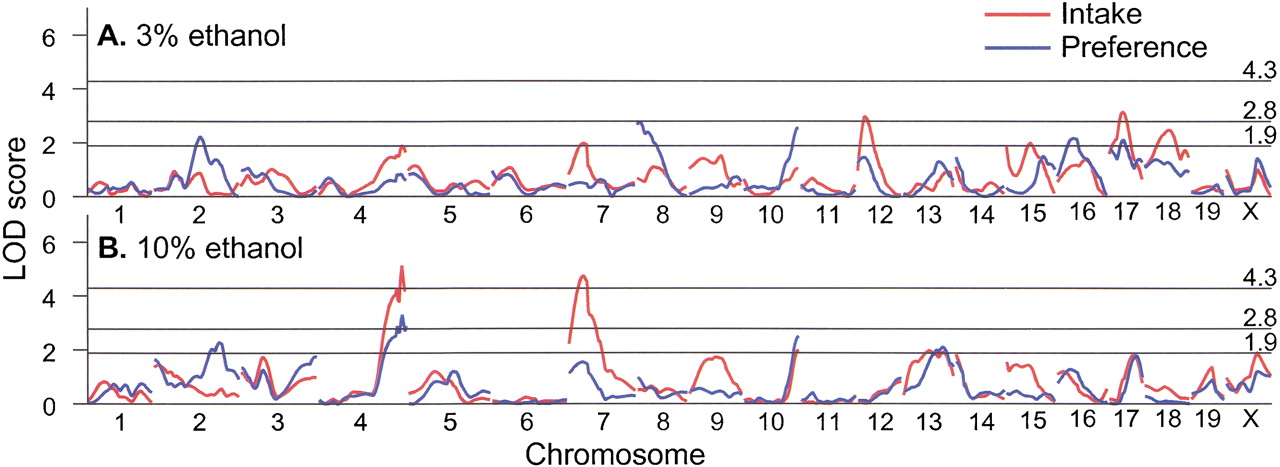
Figure 4.
Genome-wide scan for linkages with indexes of 3% (A) and 10% (B) ethanol consumption. Distances between markers were estimated using MAPMAKER/EXP. Curves trace the logarithm of the odds ratio (LOD) scores calculated under an unconstrained (free) model using MAPMAKER/QTL. Horizontal lines show thresholds for significant (LOD 4.3) and suggestive (LOD 2.8) linkages under the unconstrained model (Lander and Kruglyak 1995), and a more relaxed threshold (LOD 1.9) used to identify regions of potential linkages for additional genotyping.


