
Figure 2.
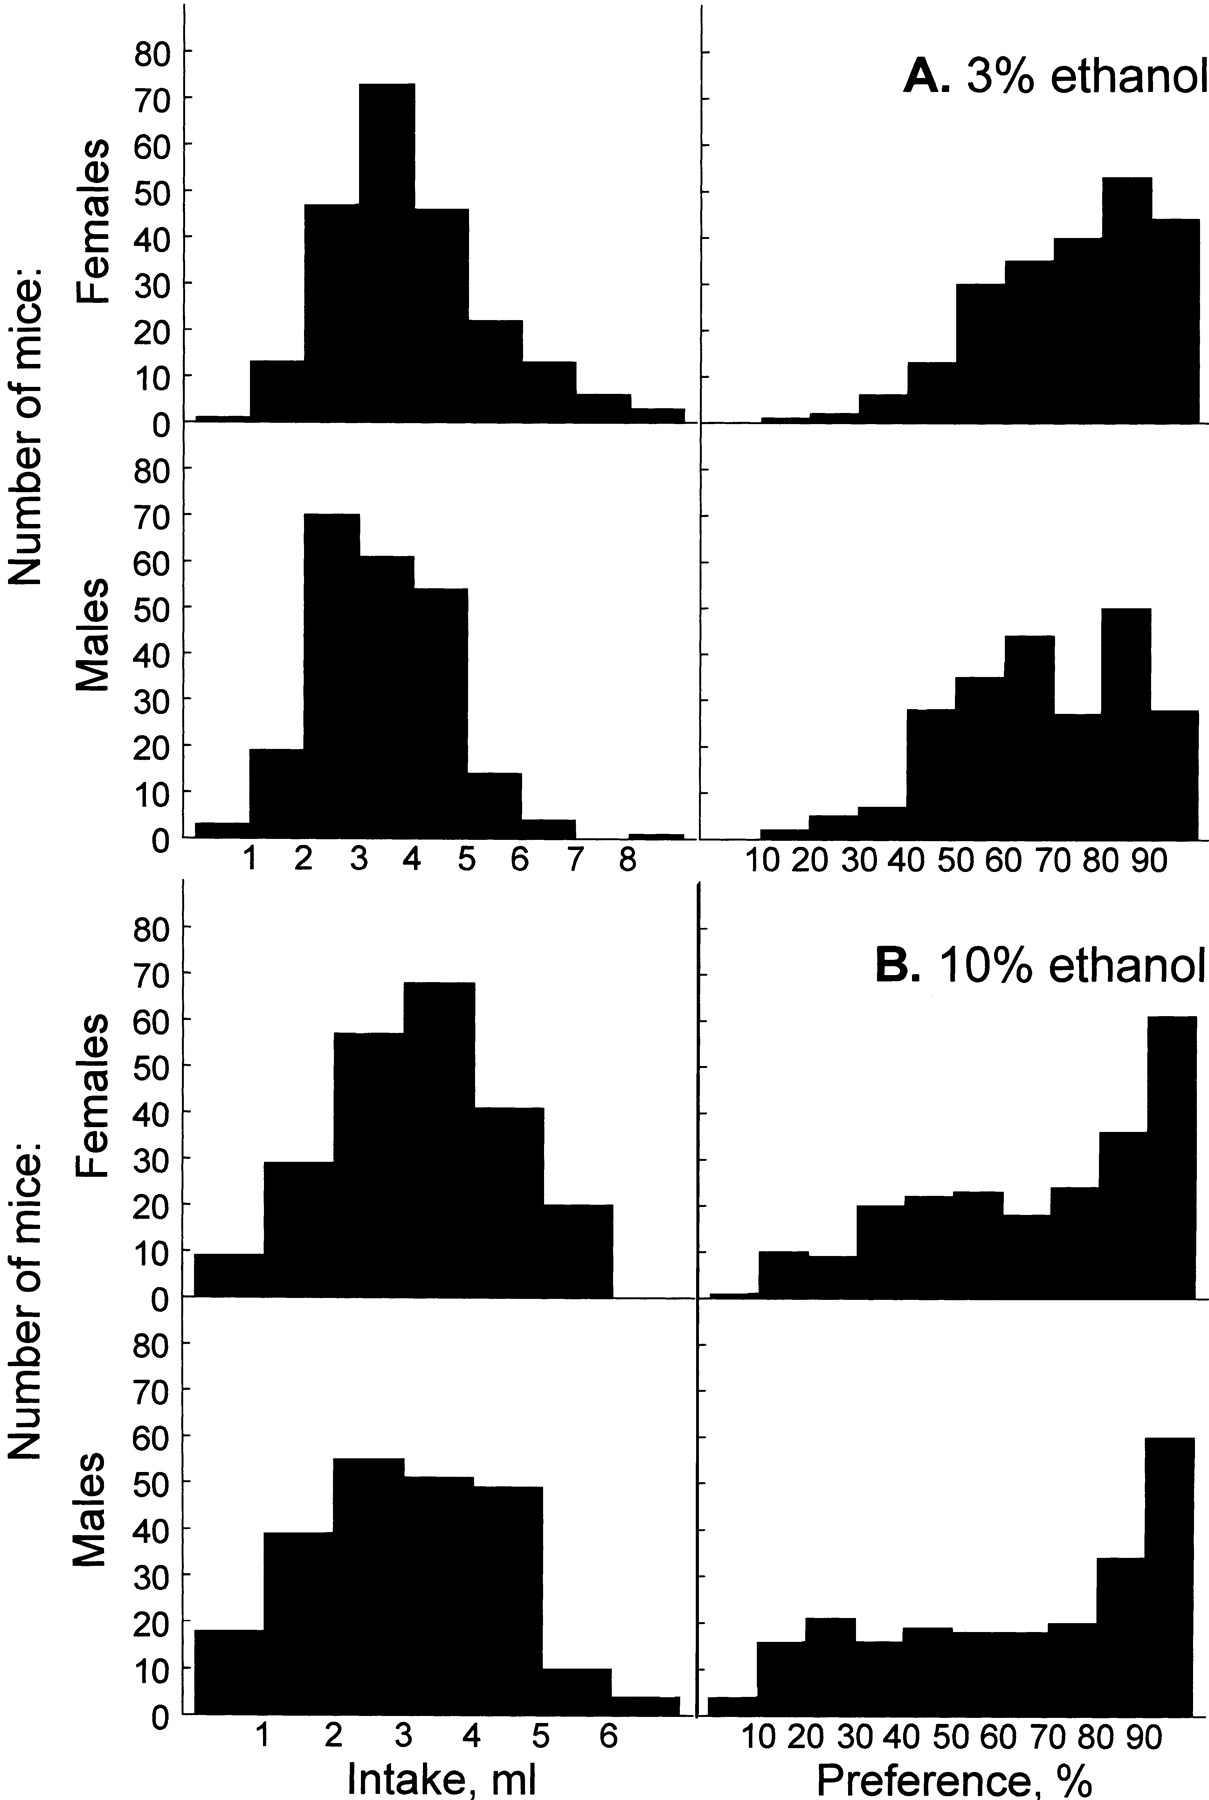
Distributions of 3% (A) and 10% (B) ethanol intakes (left) and preferences (right) in F2 mice. Top rows, females (n = 224); bottom rows, males (n = 226).
(Downloading may take up to 30 seconds. If the slide opens in your browser, select File -> Save As to save it.)
Click on image to view larger version.
Distributions of 3% (A) and 10% (B) ethanol intakes (left) and preferences (right) in F2 mice. Top rows, females (n = 224); bottom rows, males (n = 226).
 CiteULike
 Delicious
 Digg
Digg Facebook
 Google+
 Reddit
 Twitter
