
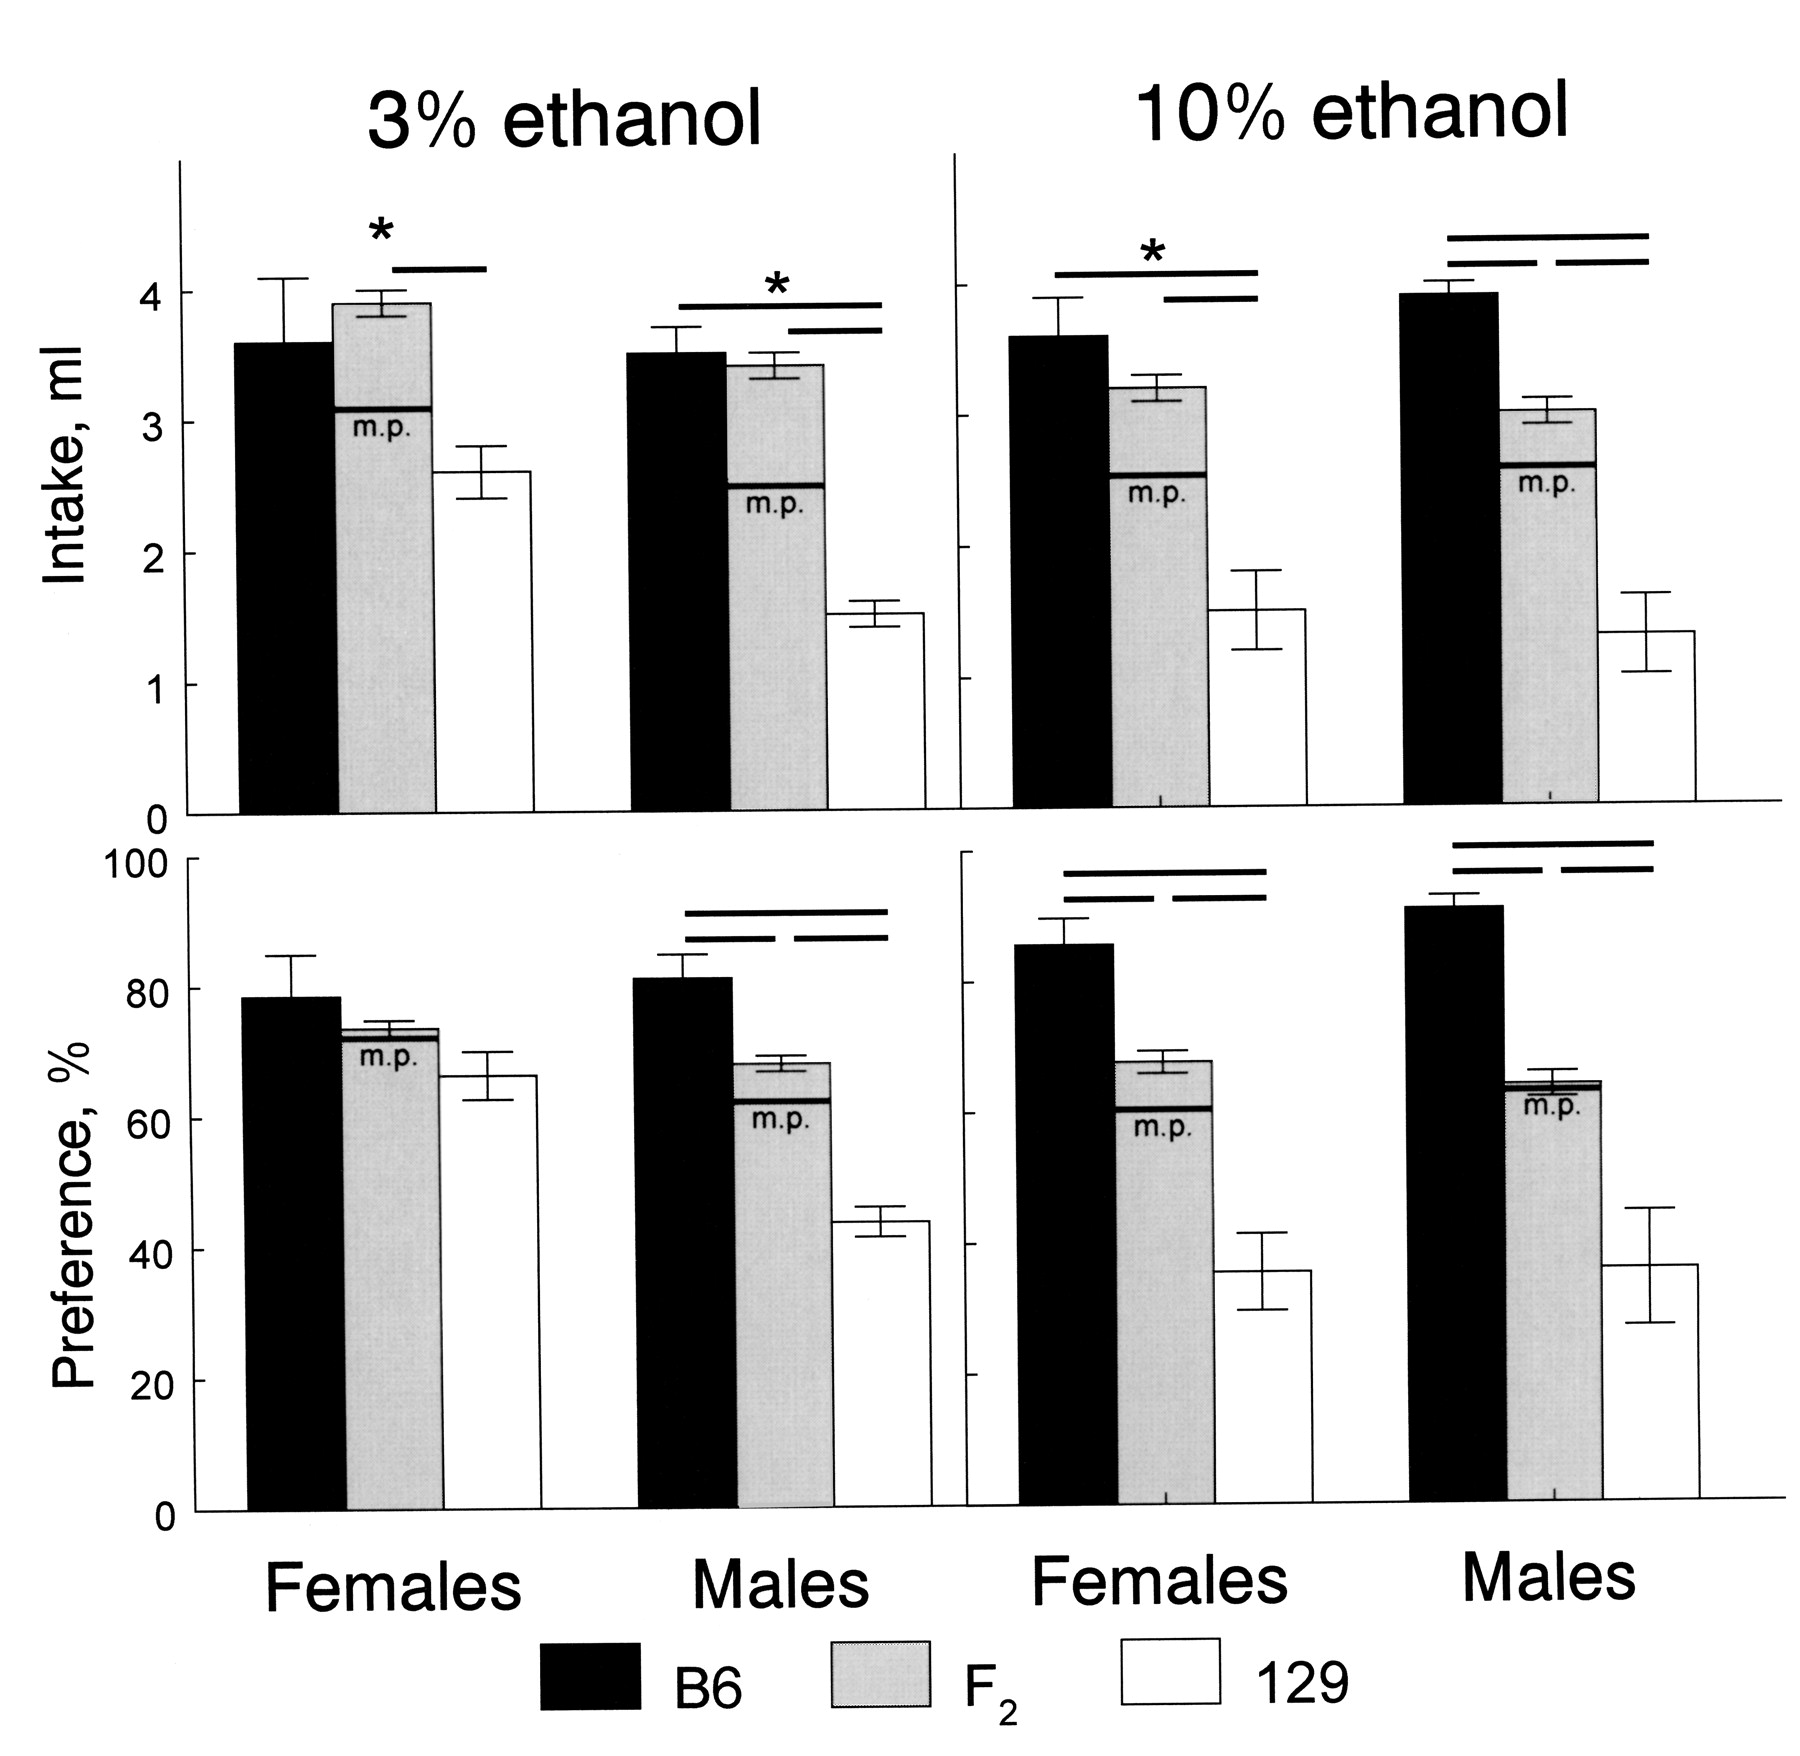
Figure 1.
Average daily ethanol intakes and preferences of B6, 129, and F2 mice (means ± standard errors). Horizontal lines above the bars represent significant differences between groups (P<0.05, planned comparisons, ANOVA). Horizontal lines labeled “m.p.” on the F2 bars show midparental values (average of B6 and 129 means). *Significant difference between F2 and midparental values (P<0.05, planned comparisons between the F2 and a collapsed value of the two parental strains).


