
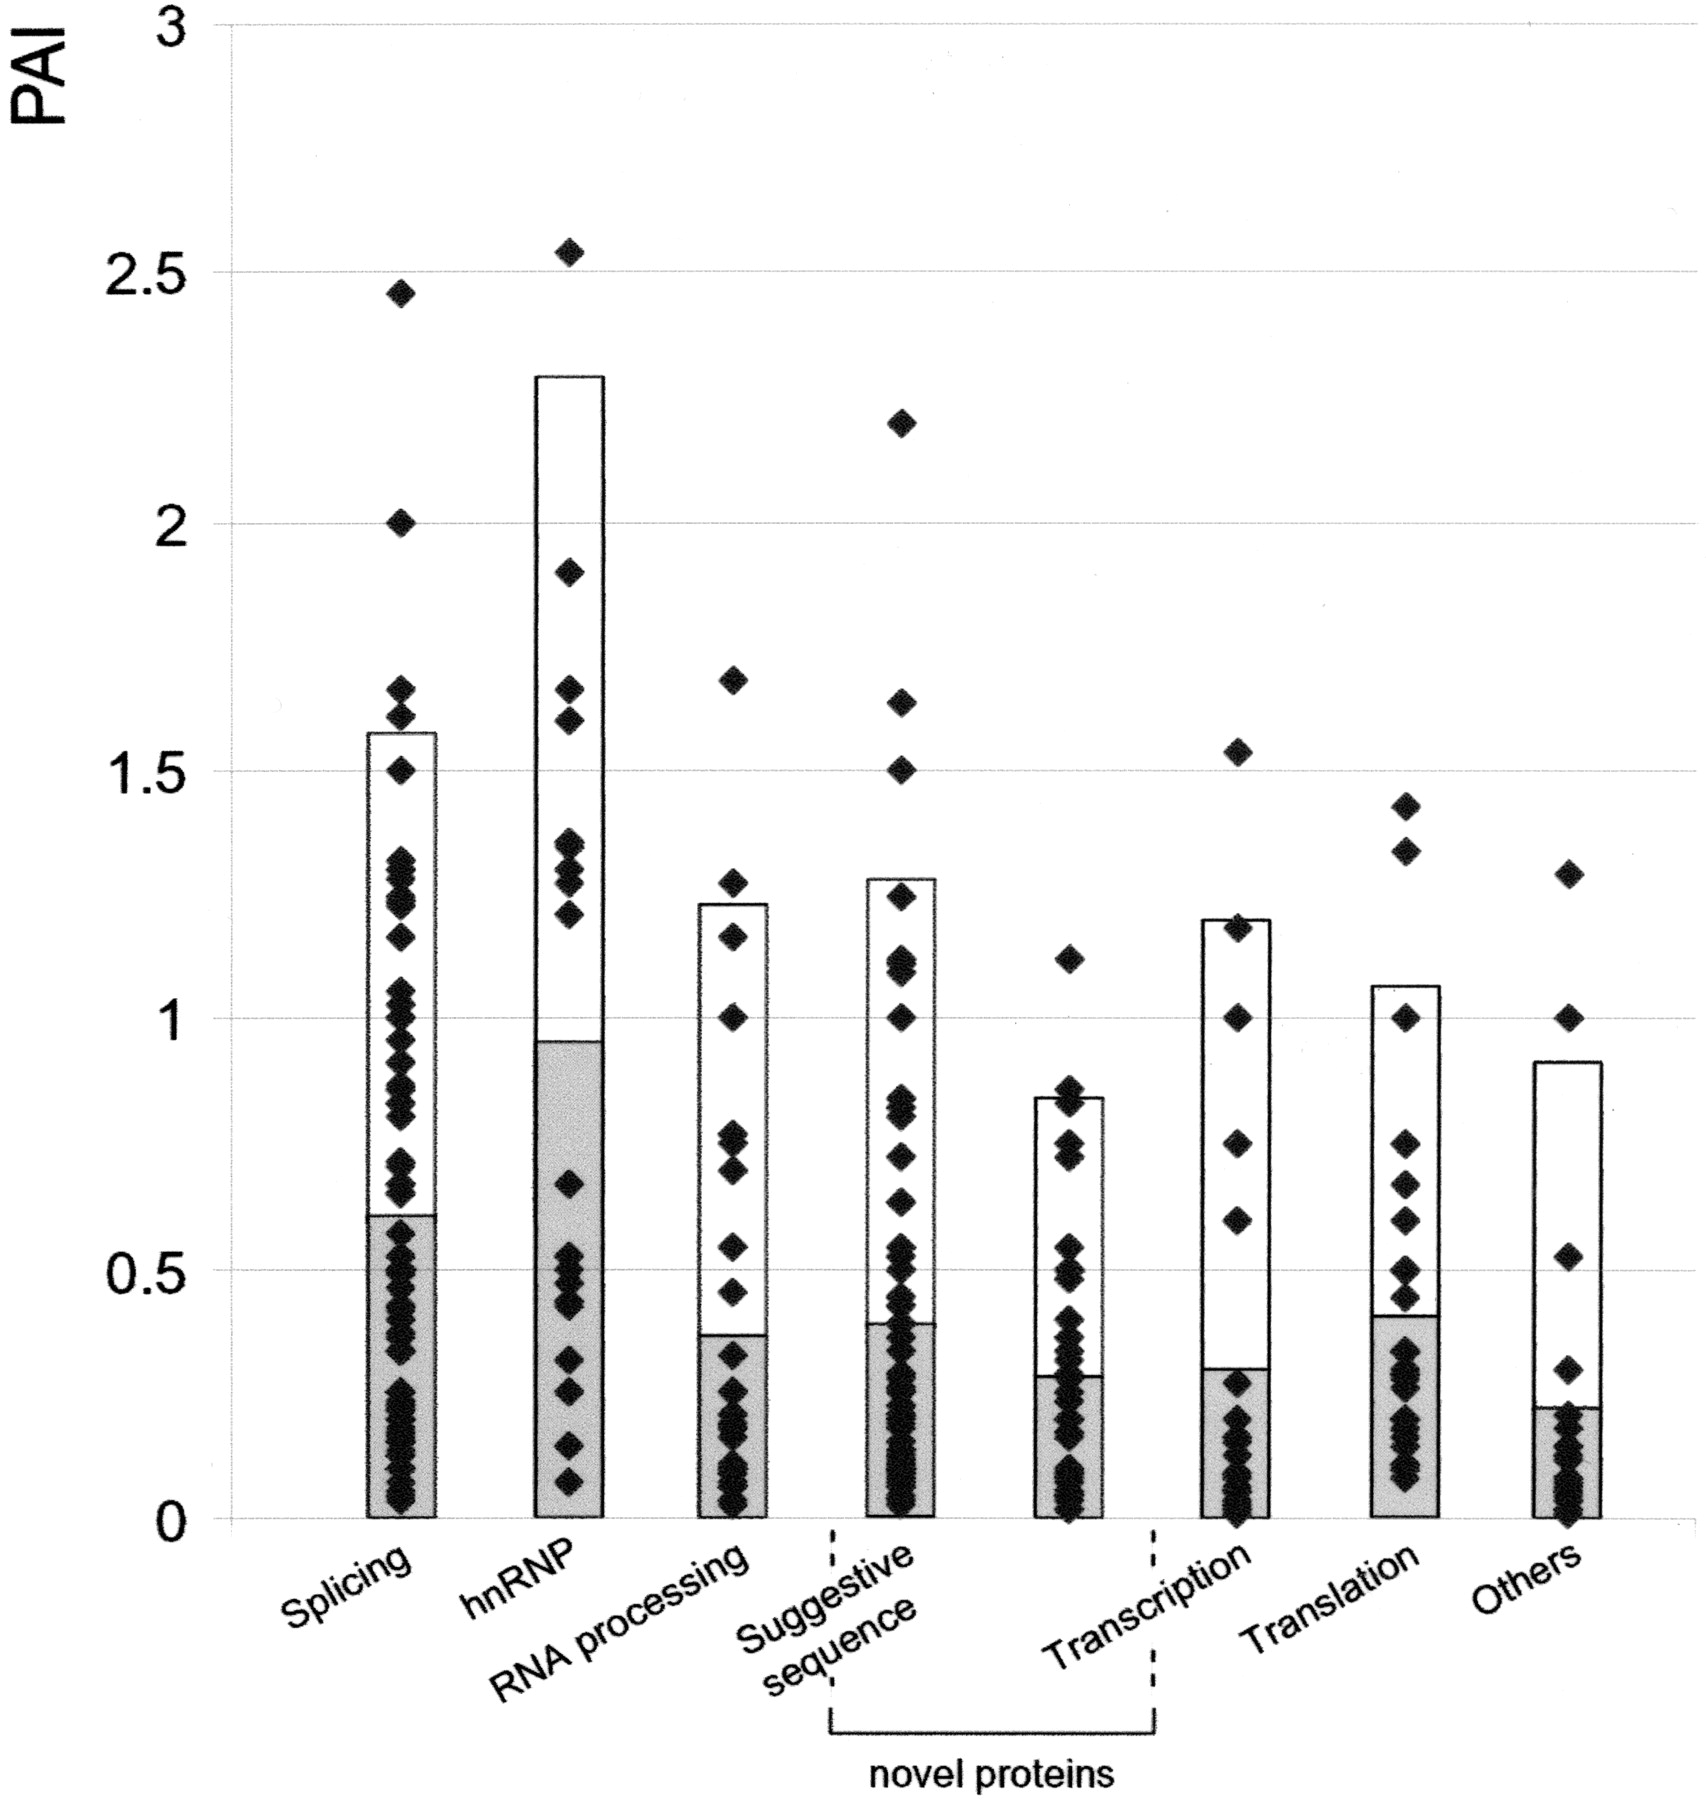
Figure 2.
Protein abundance index (PAI) for the identified proteins. Plot of PAI index, which is defined as the number of identified peptides divided by the number of calculated, observable peptides, plotted for the identified proteins in seven different classes. The individual spots represent the PAI for each protein in the category. The bar shaded in gray extents to the average value of the PAI for each category. The white bar encompasses 95% of the proteins in each category.


