
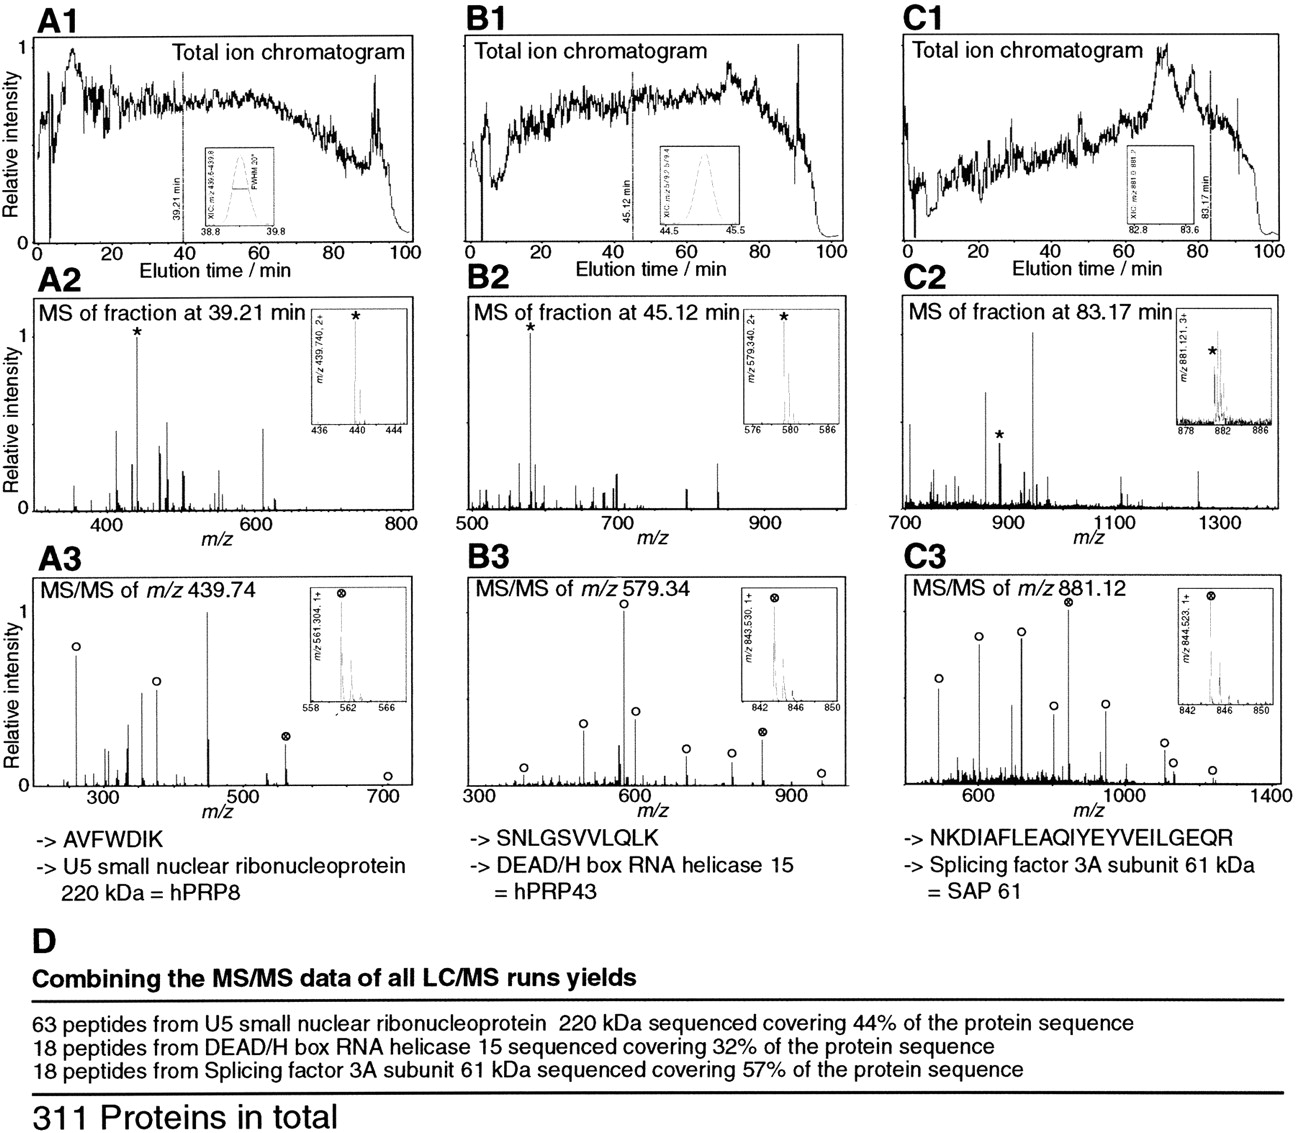
On-line LC MS/MS mass spectrometric analysis of the spliceosome. (A1) Sum of the ion intensity measured by mass spectrometry at any point in the chromatogram for the mass rangem/z = 350–550 (total ion chromatogram[TIC]), (B1) m/z = 550–750, and (C1)m/z = 750–1400. (Insets) Current for an ion of specific mass (m/z window 0.2) eluting around the marked time in the chromatogram. (A2,B2,C2) Mass spectra obtained at the marked time in the corresponding upper panels. Several peptides coelute. (Insets) Zoom of the peak marked with an asterisk. (A3,B3,C3) Fragmentation spectra of the peak marked with an asterisk in the corresponding mass spectra above. The insets show that there was high resolution and the ability to determine the charge state by the differences between isotopic peaks. Open circles mark the peaks corresponding to predicted fragments for the peptide sequence retrieved by the database search. The insets show that there was high-quality data for the fragments, which aided the database search and validation. (D) The proteins identified by the peptides shown in A–C are also independently identified by a large number of other peptide fragmentation spectra, leading to substantial sequence coverage of 32%–57% for these three proteins.


