
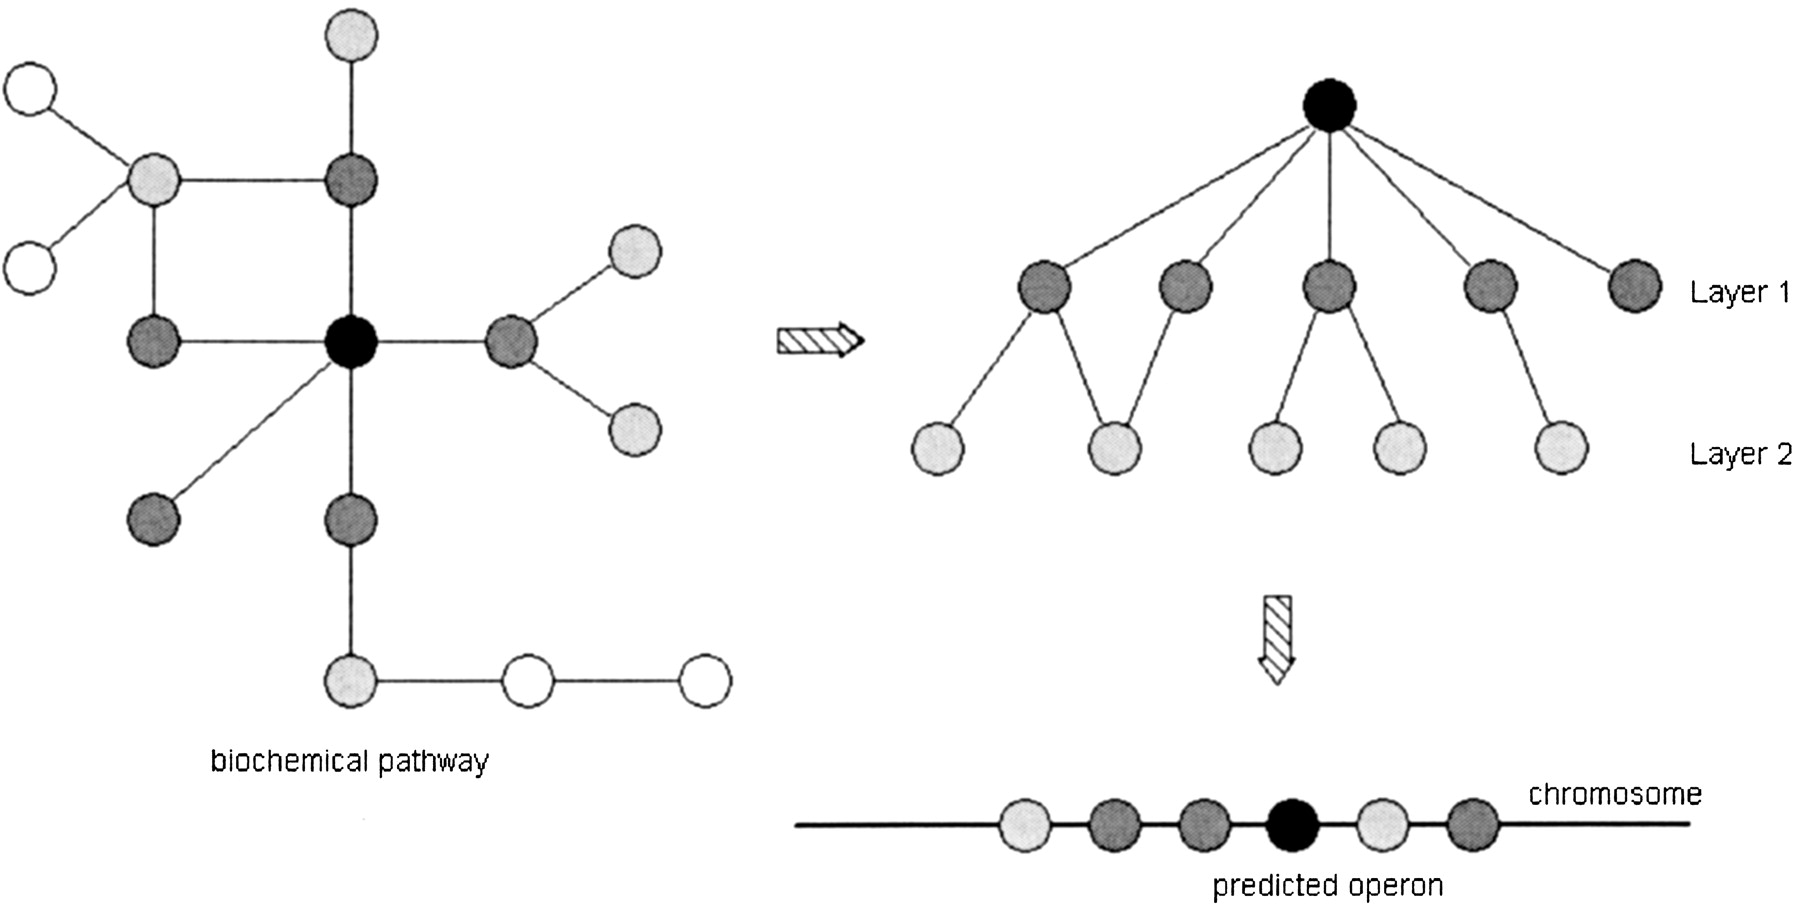
Figure 6.
A graphical interpretation of breadth-first search (BFS) graph traversal. The black vertex is the start vertex for BFS traversal in a metabolic pathway. In this example, the depth parameter is set to 2; the first layer is filled with dark gray and the second layer is filled with light gray. After a tree is returned from traversal, we locate the gene in the genome with the same EC number as the start vertex and extend a window on each side of it. We then compare genes in this window and in the traversal tree by EC numbers. If there is more than one match, this gene cluster window is marked for further pruning.


