
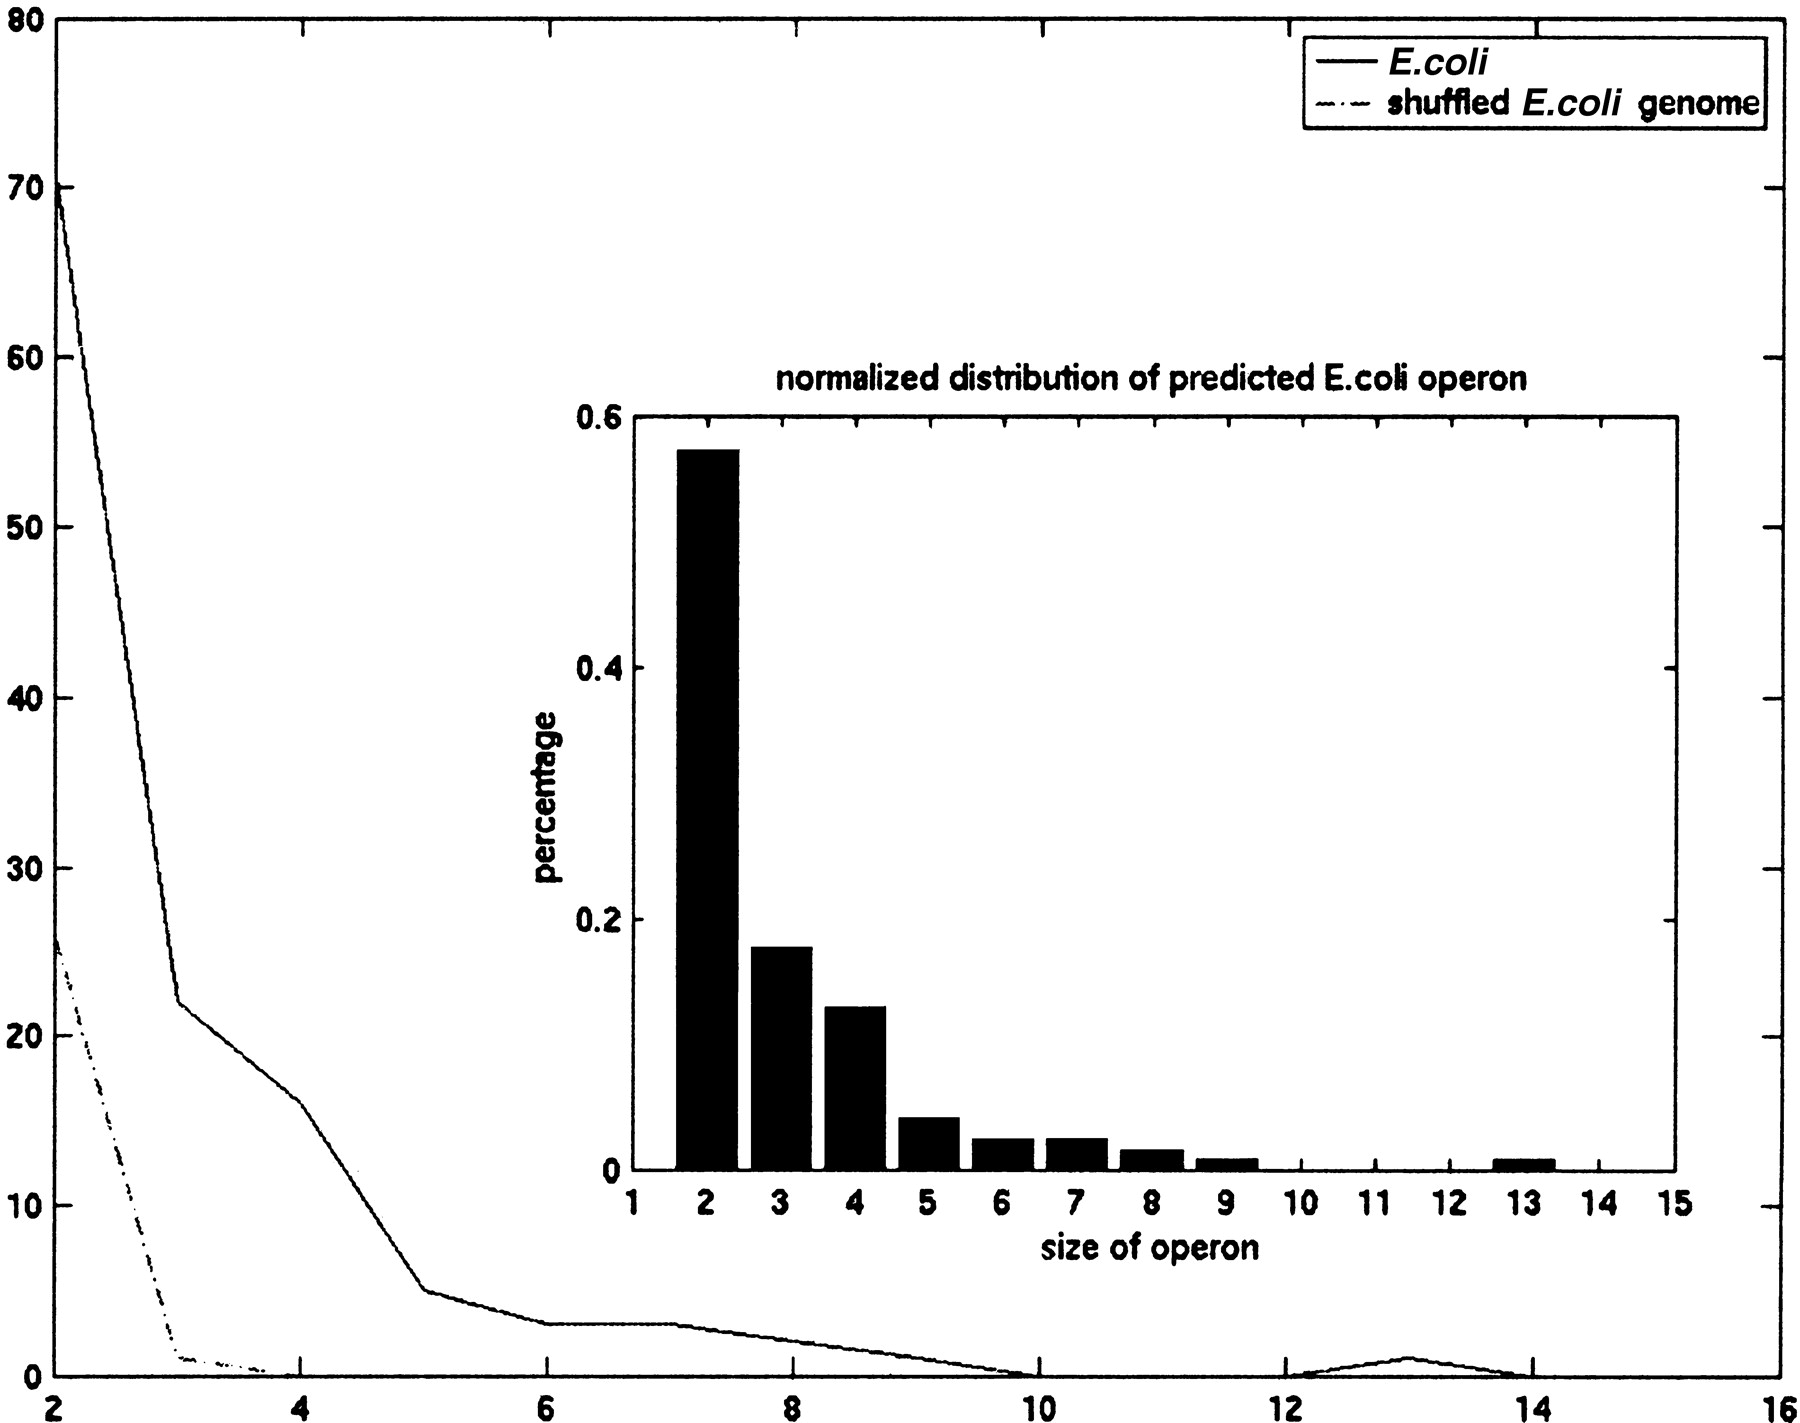
Figure 3.
Distribution of operon length in E. coli. The solid line shows the distribution of operon length in the E. coli genome. The broken line shows the distribution in the randomly shuffled E. coli genome. (inset) A normalized histogram of operon length distribution in E. coli.


