
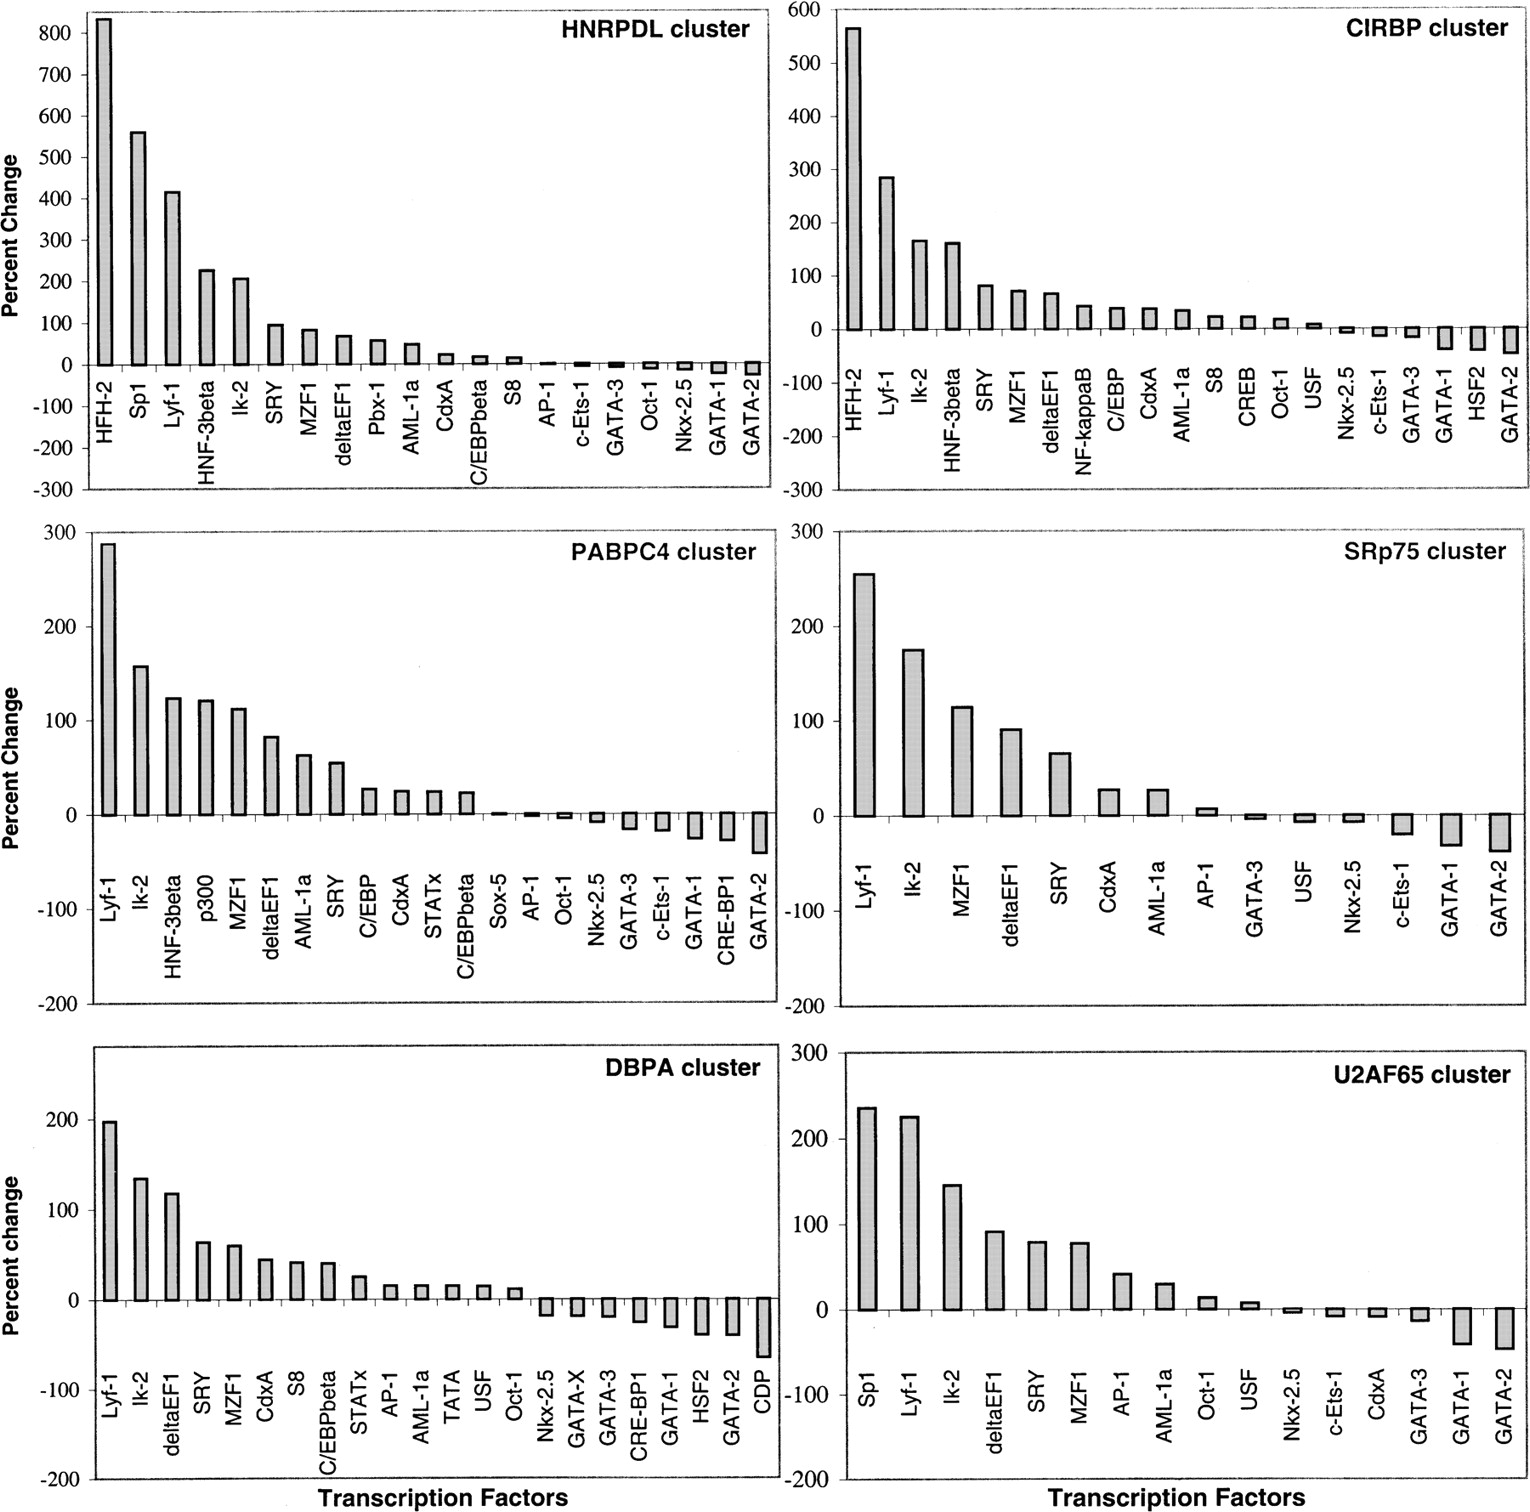
Figure 4.
Relative abundance of transcription factor binding sites in experimentally derived versus random DNA sequence clusters. Each panel refers to a cluster of genes coregulated with a queried gene. The ratio of the relative abundance of each transcription factor binding site in a real (experimentally derived) compared with a random DNA sequence cluster is expressed as a percent change on the Y-axis. Transcription factors are plotted on the X-axis.


