
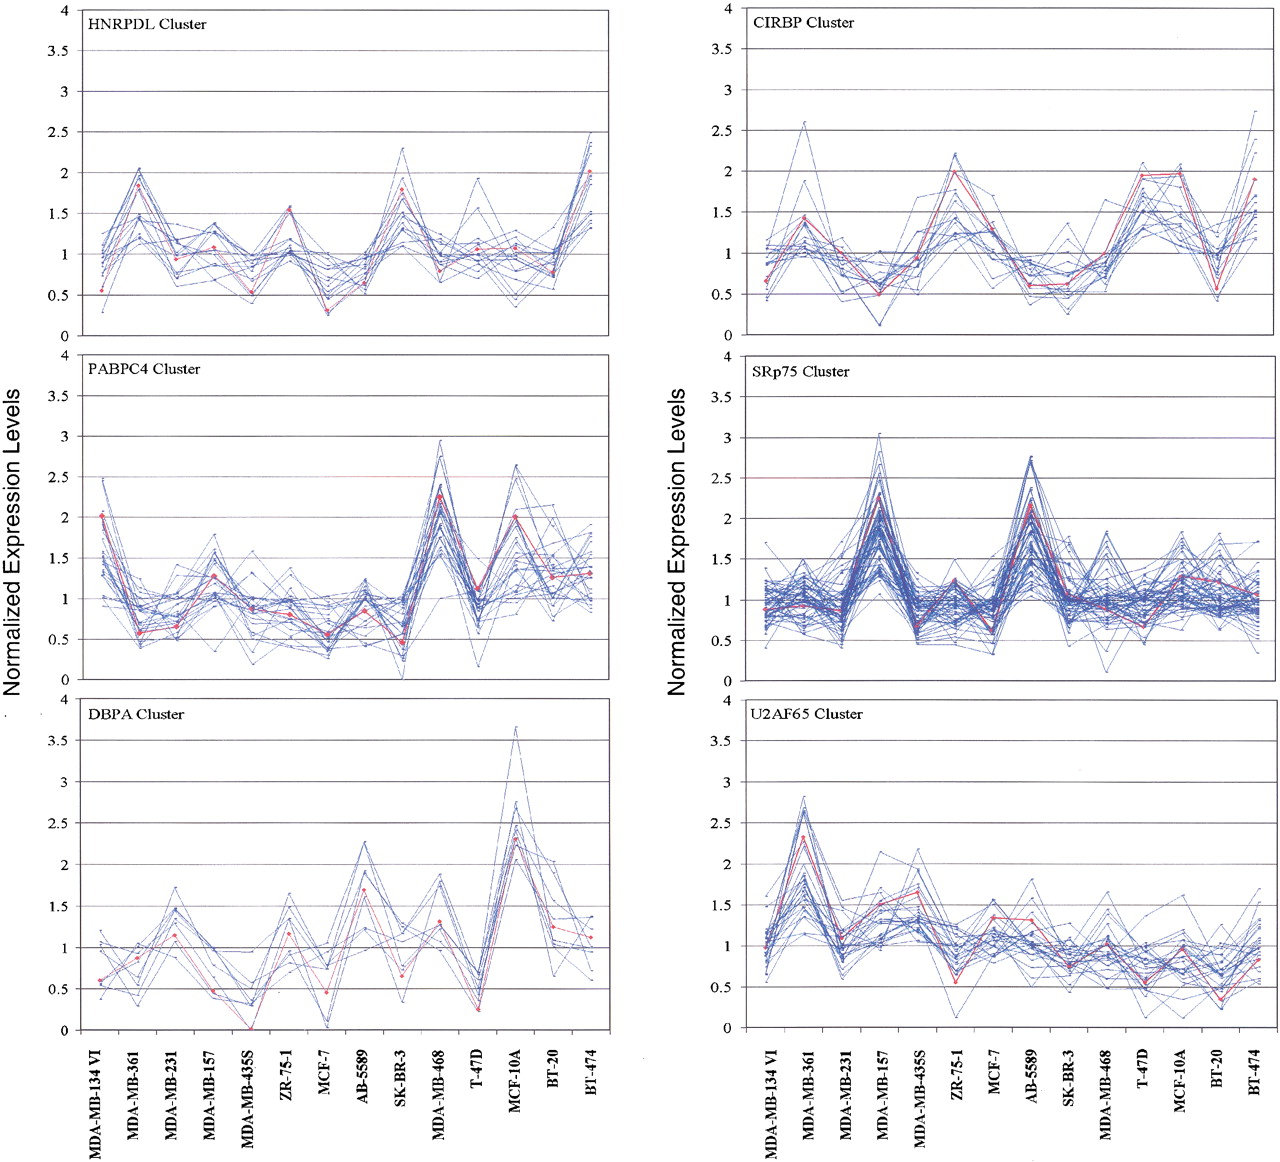
Figure 3.
Clustering genes with similar expression patterns in 14 different breast-derived cell lines. Each panel displays groups of genes (in blue) with similar expression patterns in the indicated (normal and cancer) cell lines to the query gene (in red) denoted at top. GeneChips were scaled to 2500 and each gene was median centered by computing its median expression level across all of the cell lines (provided that this value was at least 10 and that the ratio of the absolute expression and median was at least 0.001). Selection was done by use of a Pearson correlation with a threshold >0.95 withGeneSpring software 4.11.


