
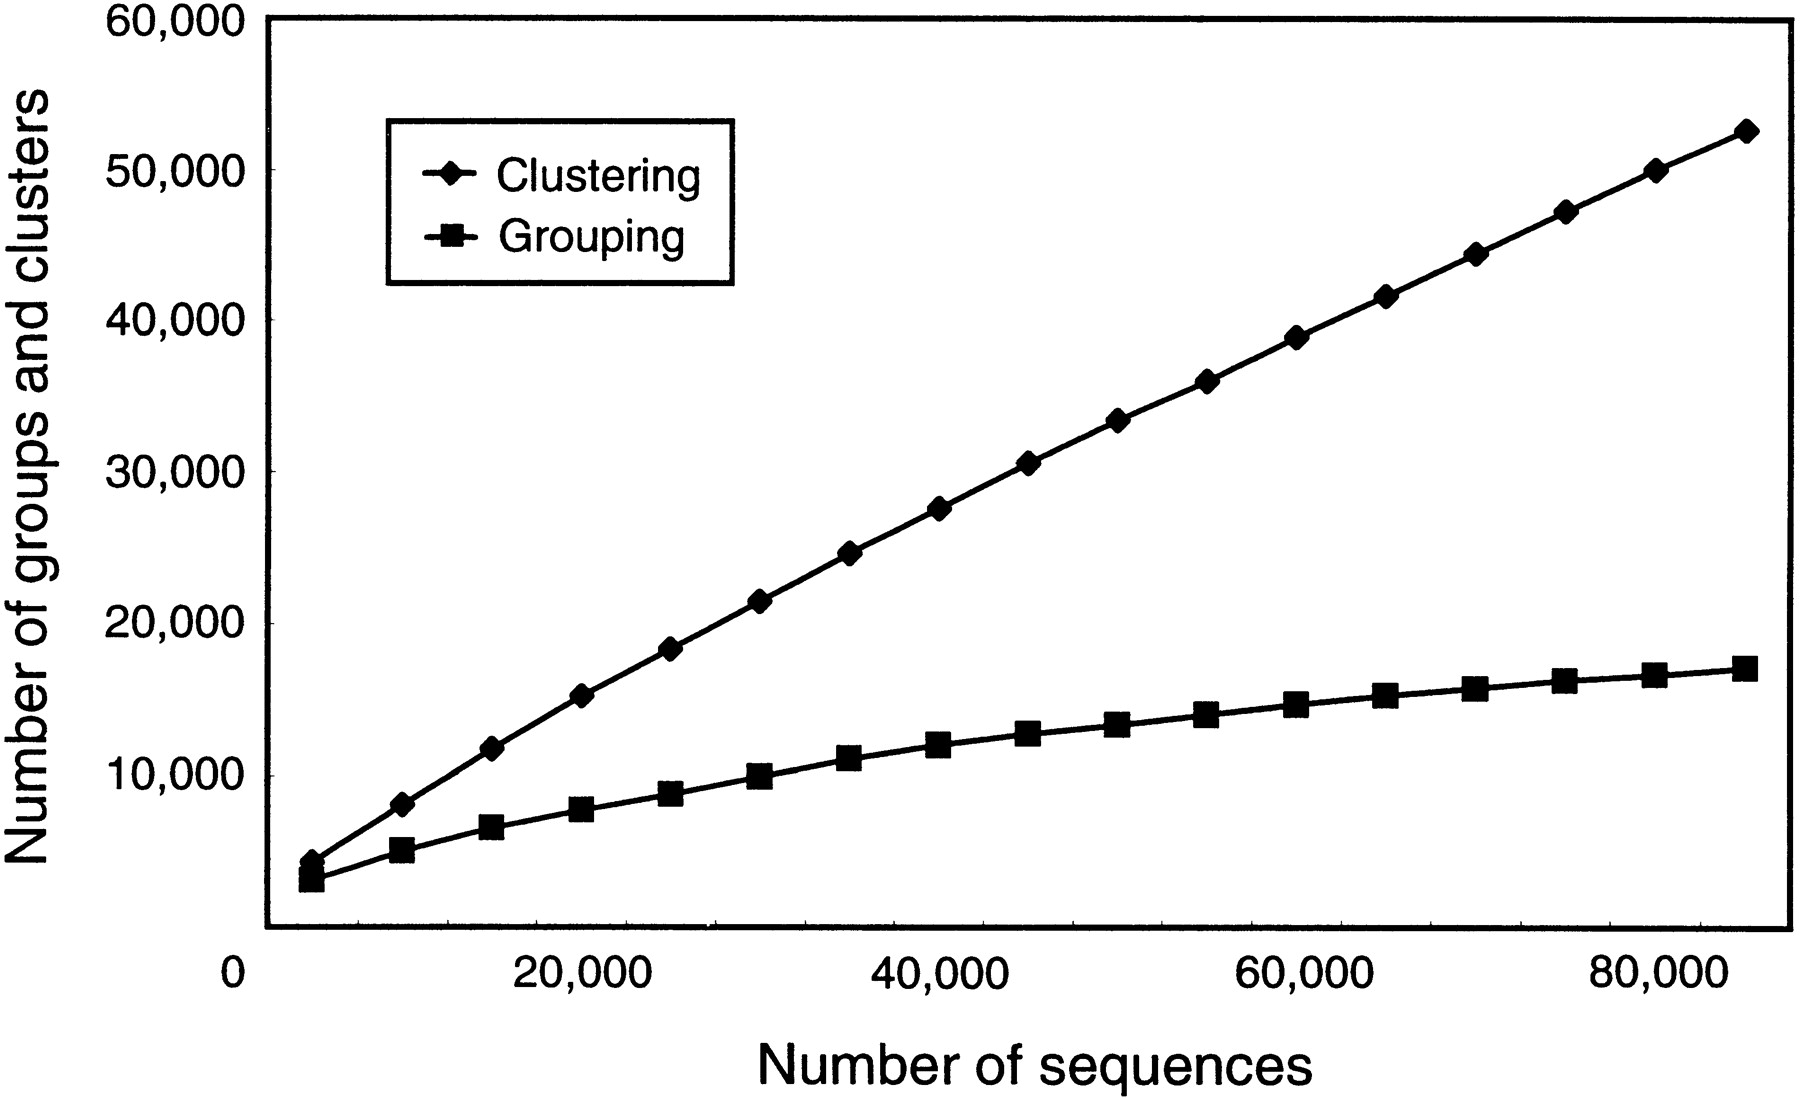
Figure 3.
An increased number of groups and clusters of 3′ end sequences in the rice full-length cDNA project. As end sequences were determined, the number of novel groups and clusters increased, whereas the rate of the increase gradually decreased.


