
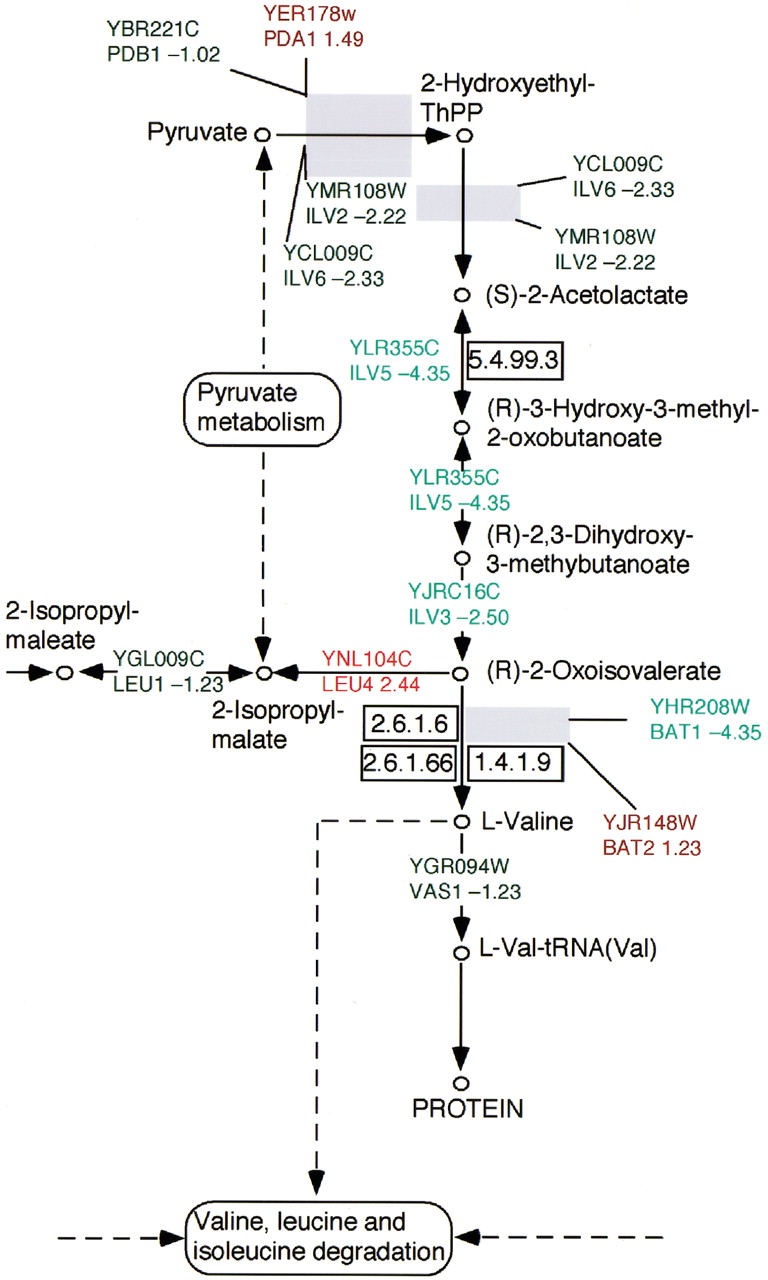
Figure 2.
Part of the Expression Mapper output for valine, leucine, and isoleucine metabolism, adapted from KEGG map 290. The text is colored red if the relative change in gene expression is ≥1, and green if it is <1. The intensity of the color is proportional to the magnitude of the differential expression. The presence of a gray box indicates that the corresponding step in the biochemical pathway requires multiple gene products.


