
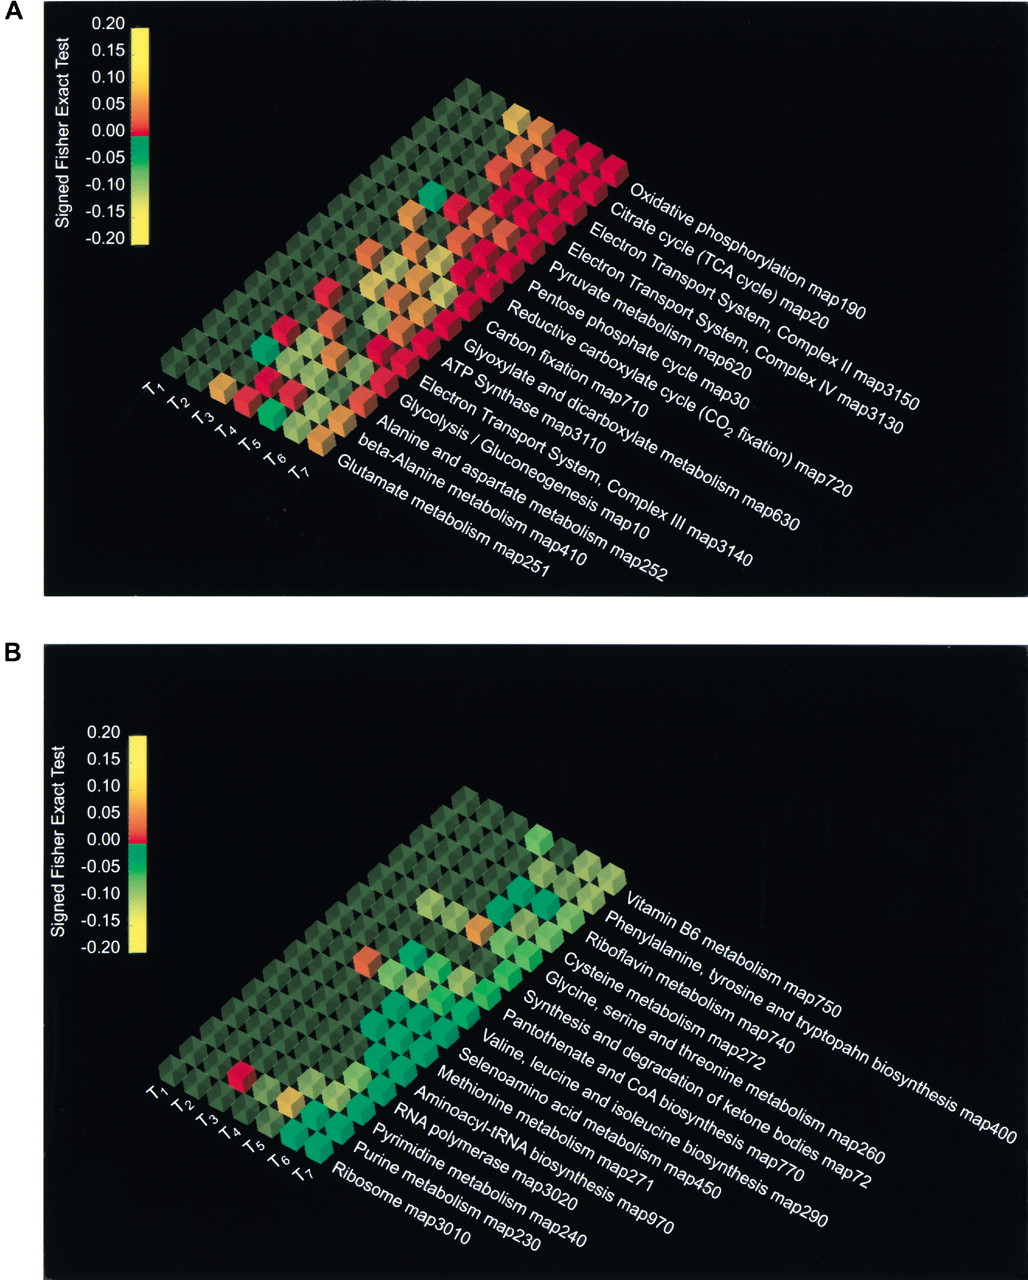
Pathway Analyzer results showing the 15 most activated pathways (A) and the 15 most repressed pathways (B) for the seven timepoints of the diauxic shift experiments. The columns from T1 to T7 report the P-values of the Signed Fisher Exact Test, obtained from the comparison of relative expression at T0 to that at the different timepoints of the diauxic shift experiments, with T1 = 9 h, T2 = 11 h, T3 = 13 h, T4 = 15 h, T5 = 17 h, T6 = 19 h, and T7 = 21 h. The data have been sorted according to their ranking in the last experiment, T7 versus T0. The pathways are visualized using OpenDX. The color of the cube indicates the sign of the variation, with red being up-regulated, green down-regulated, and yellow no change. The opacity represents the statistical significance of the variation: the greater the opacity, the smaller the P-value. The color of the cube depends on theP-value in the following way: from 1 to 0.15 the color remains yellow, from 0.15 to 0 with overexpression (+) it goes from yellow to red, and from 0.15 to 0 with underexpression (−) it goes from yellow to green.


