
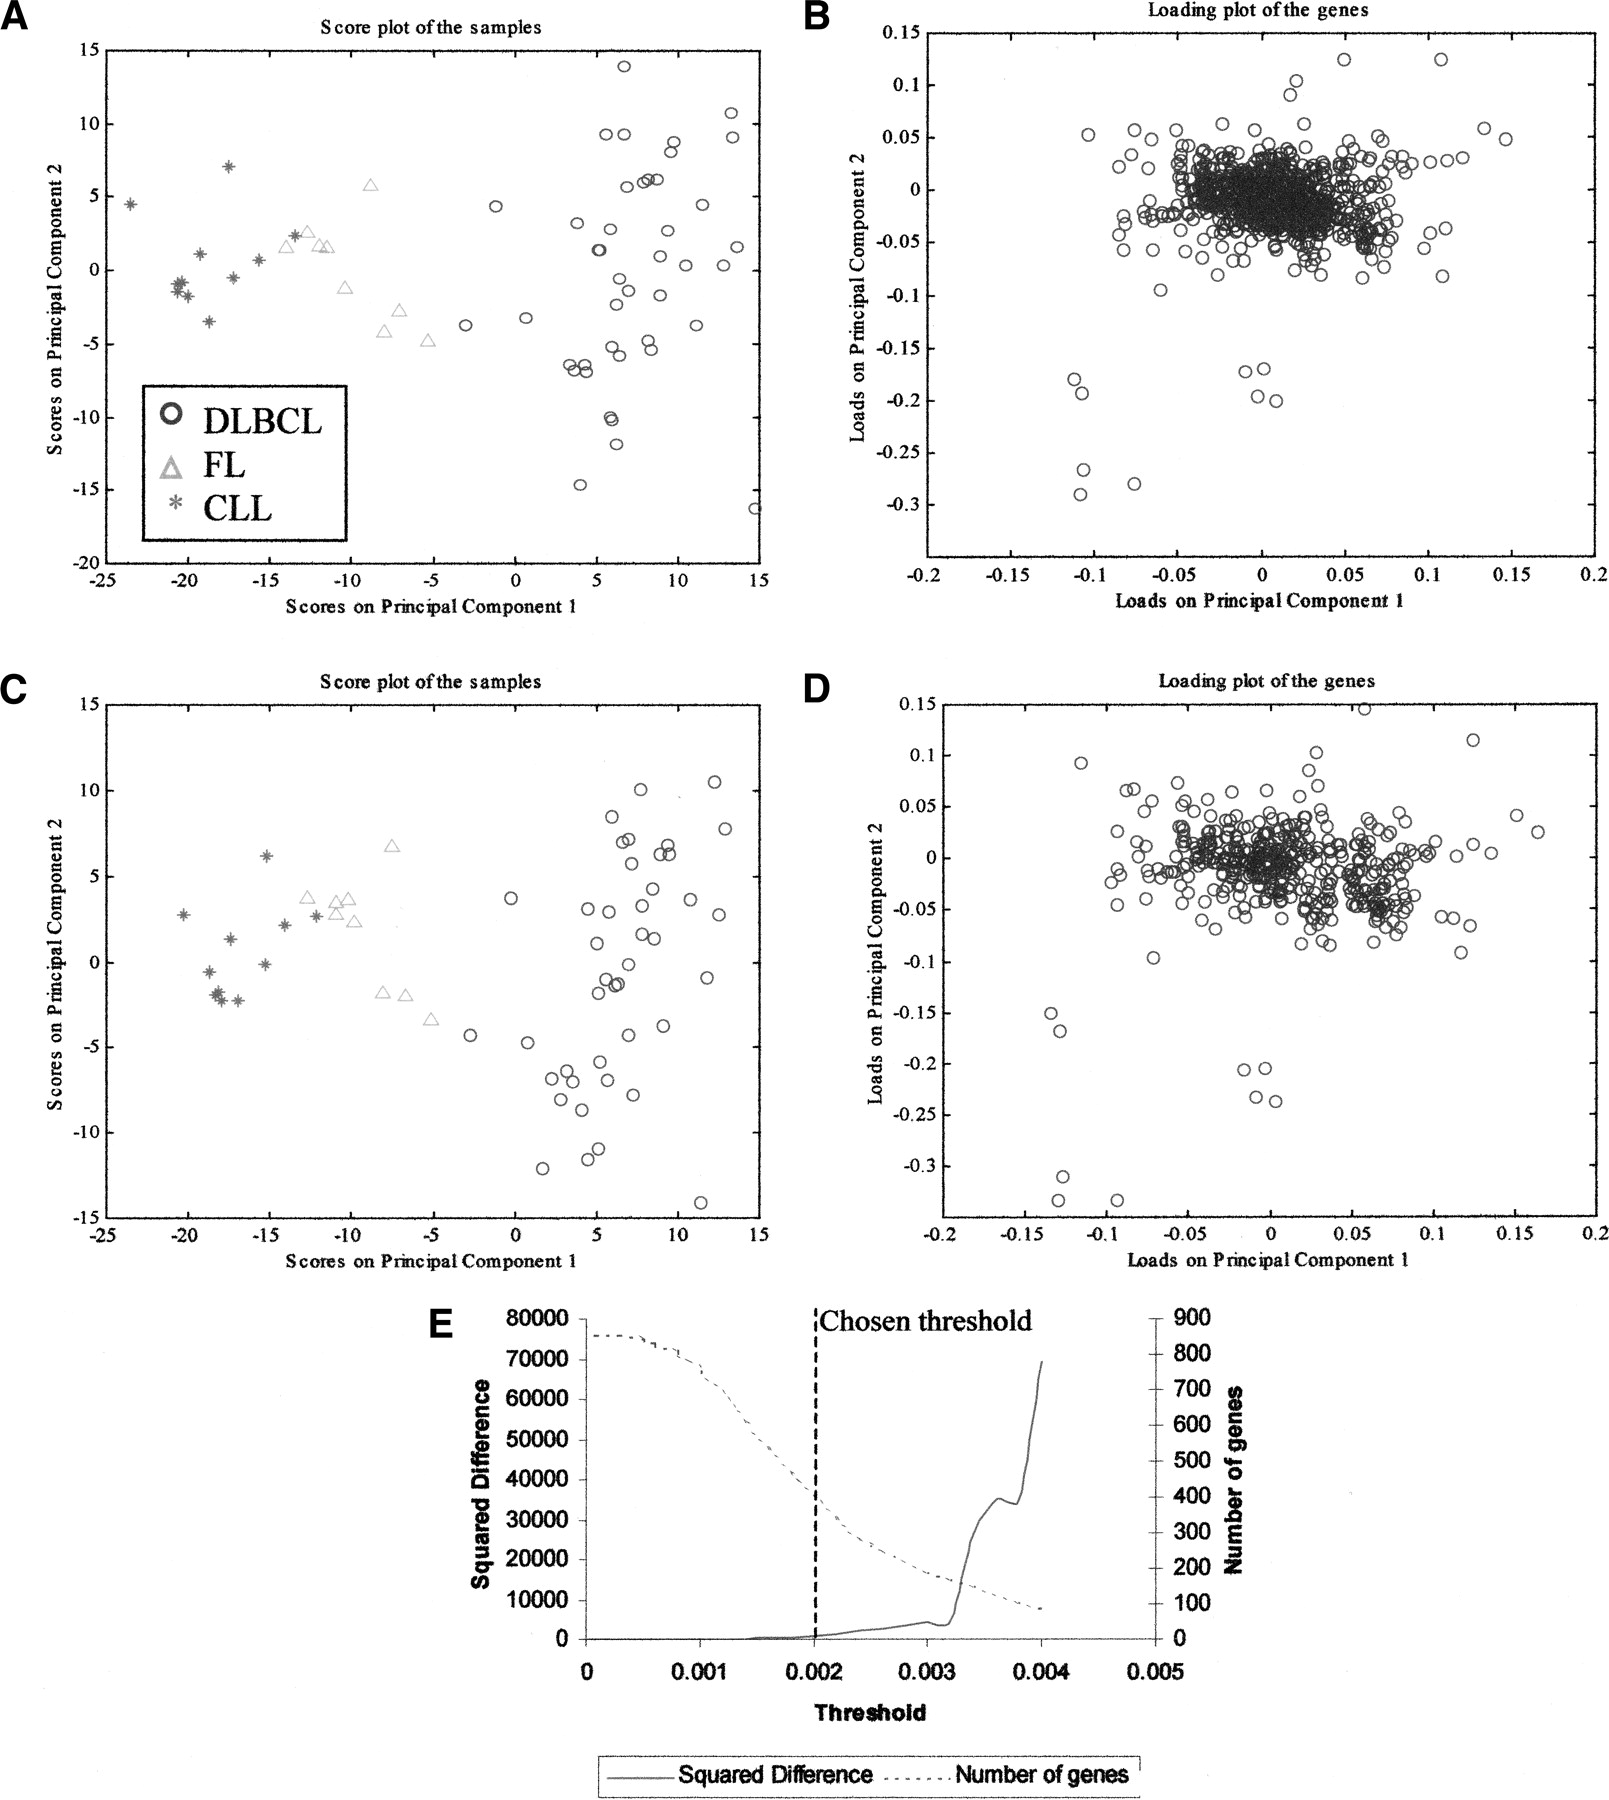
Figure 3.
Projection of the lymphoma samples using the principal component analysis. The projection already reveals a fairly clear separation of the three classes in the data. The thresholding procedure allows for the identification of 401 genes from ∼850 cDNA clones, which are sufficient to describe the patterns observed. (A, B) The score and the loading plot prior to thresholding. (C,D) The score and loading plot post-thresholding. (E) The effect of thresholding on the number of genes retained and the squared difference. The chosen threshold, 0.002, is the point beyond which the squared difference explodes.


