
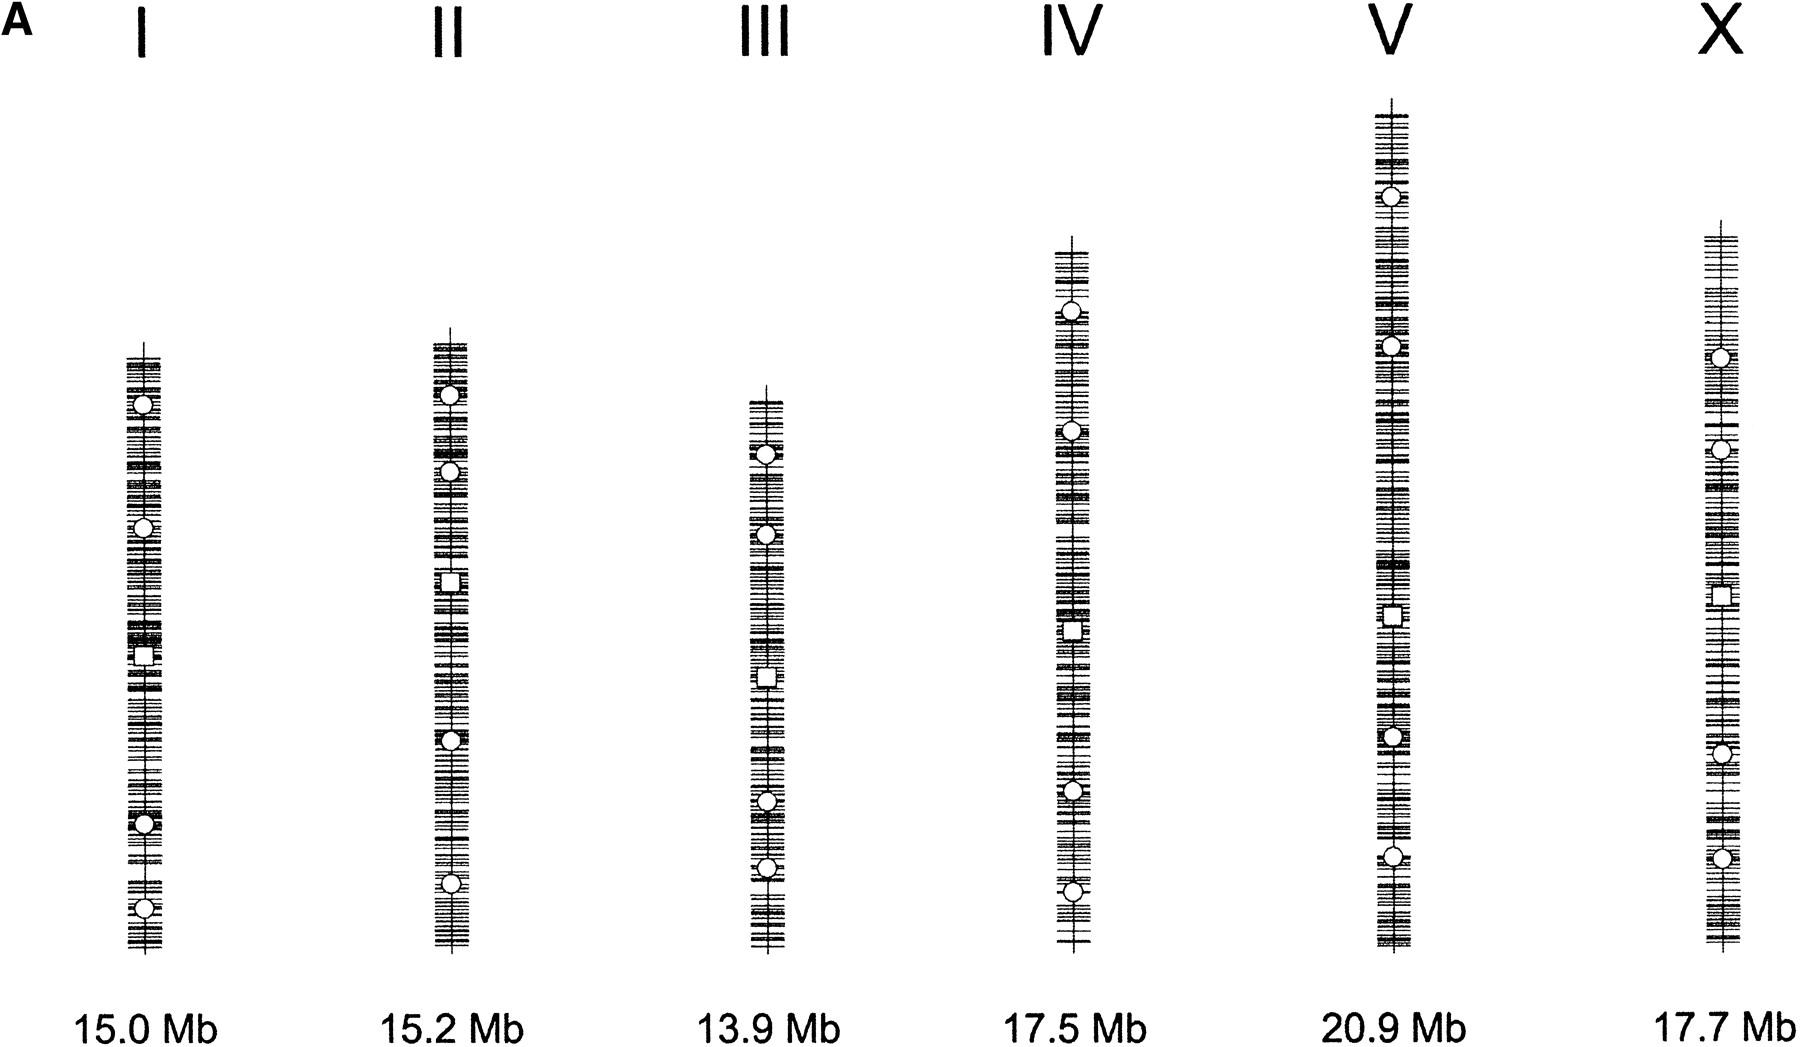
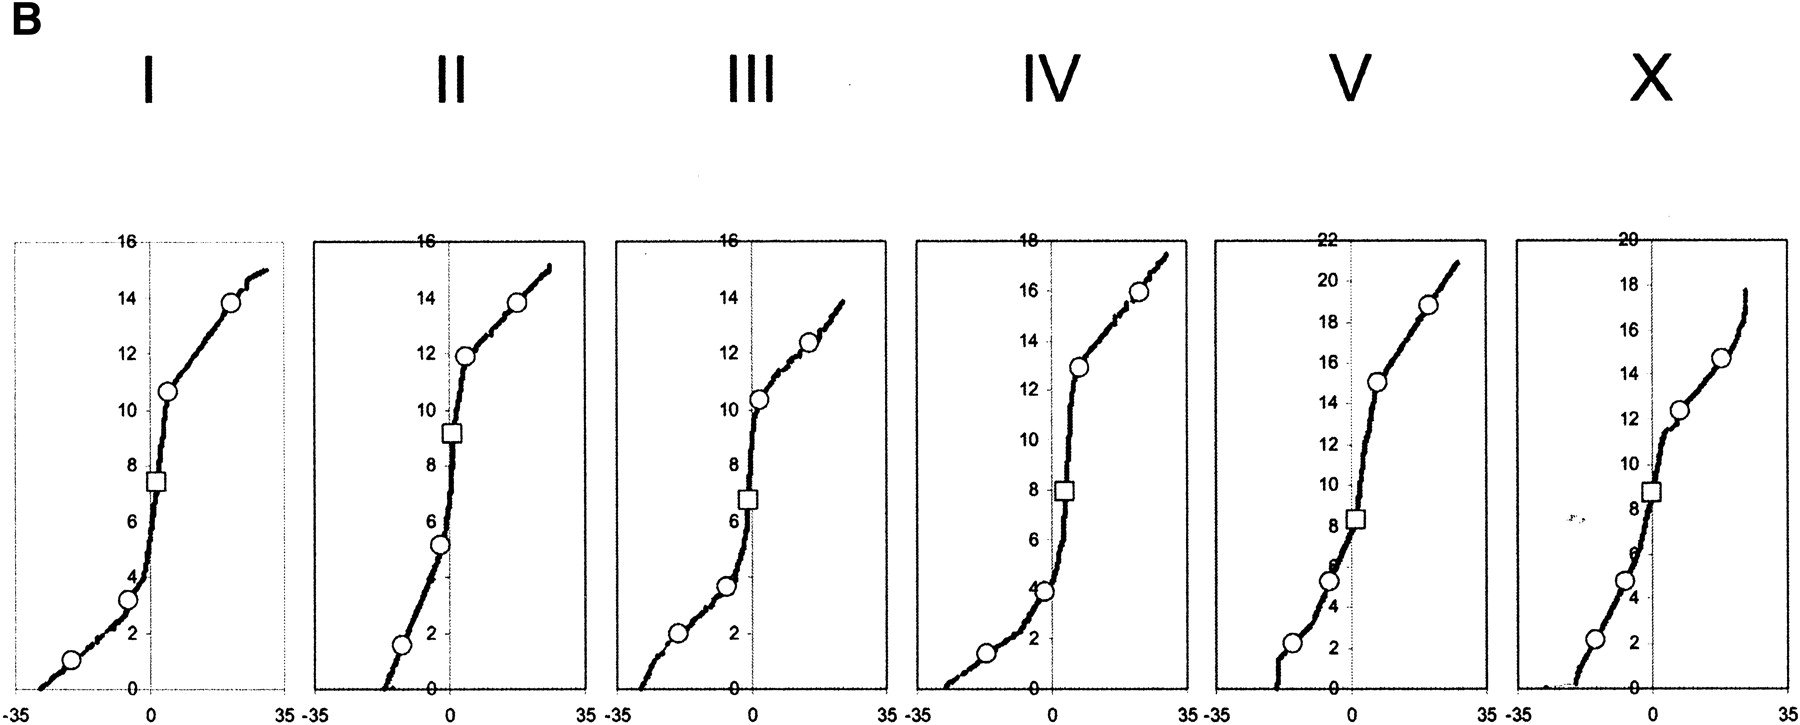
Distribution of single nuclear polymorphism (SNP) markers across theCaenorhabditis elegans genome. (A) Marker distribution along the physical map of chromosome. The location of the Tier 1 SNP markers are shown with open squares, and the location of Tier 2 markers are shown by open circles. The location of each of the validated 1099 markers is shown along the chromosomal axis. The largest gap is 449 kb (chromosome I), and the average validated marker spacing is 91 kb ± 56 kb. (B) Recombination rates across the six chromosomes. The physical (Mb) location of all predicted polymorphisms (y-axis) is plotted versus the extrapolated genetic (cM) location (x-axis) of the associated cosmid across the genome (Genetic Map Position from Wormbase; Stein et al. 2001). This illustrates the rate of change in the recombination rate across the chromosome and shows the “gene cluster” effect in the center of the autosomes (Barnes et al. 1995). This information is used during mapping, because the local recombination rate affects the number of putative recombinants that must be genotyped to obtain a 100-kb interval.


