
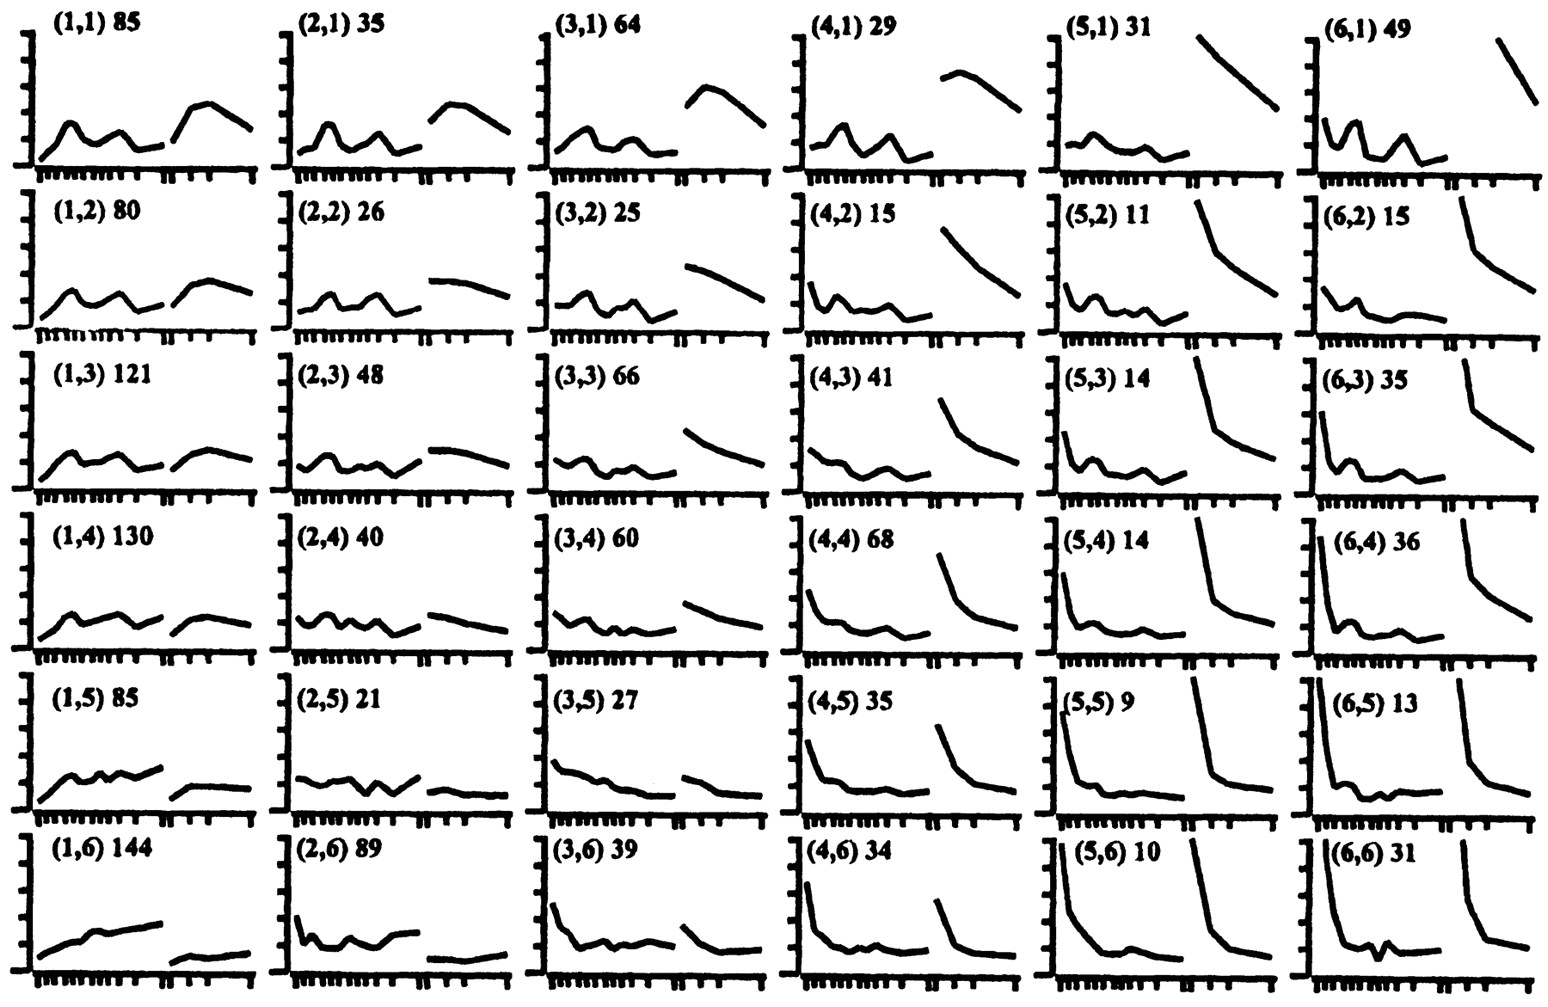
Figure 2.
A 6 × 6 matrix displaying the clustered profiles of genes changing over 2.5-fold at any given point. Cluster number is enclosed by parentheses; total number of genes per cluster are outside parentheses. The Y-axis represents normalized relative expression, the X-axis shows both time courses (time course 1 following differentiation over a 14 d period containing 12 data points and time course 2 following differentiation over a 9 d period containing 4 data points). The average profile for each cluster is shown. Genes included in each cluster are listed in Supplemental Tables 2–37 available online.


