
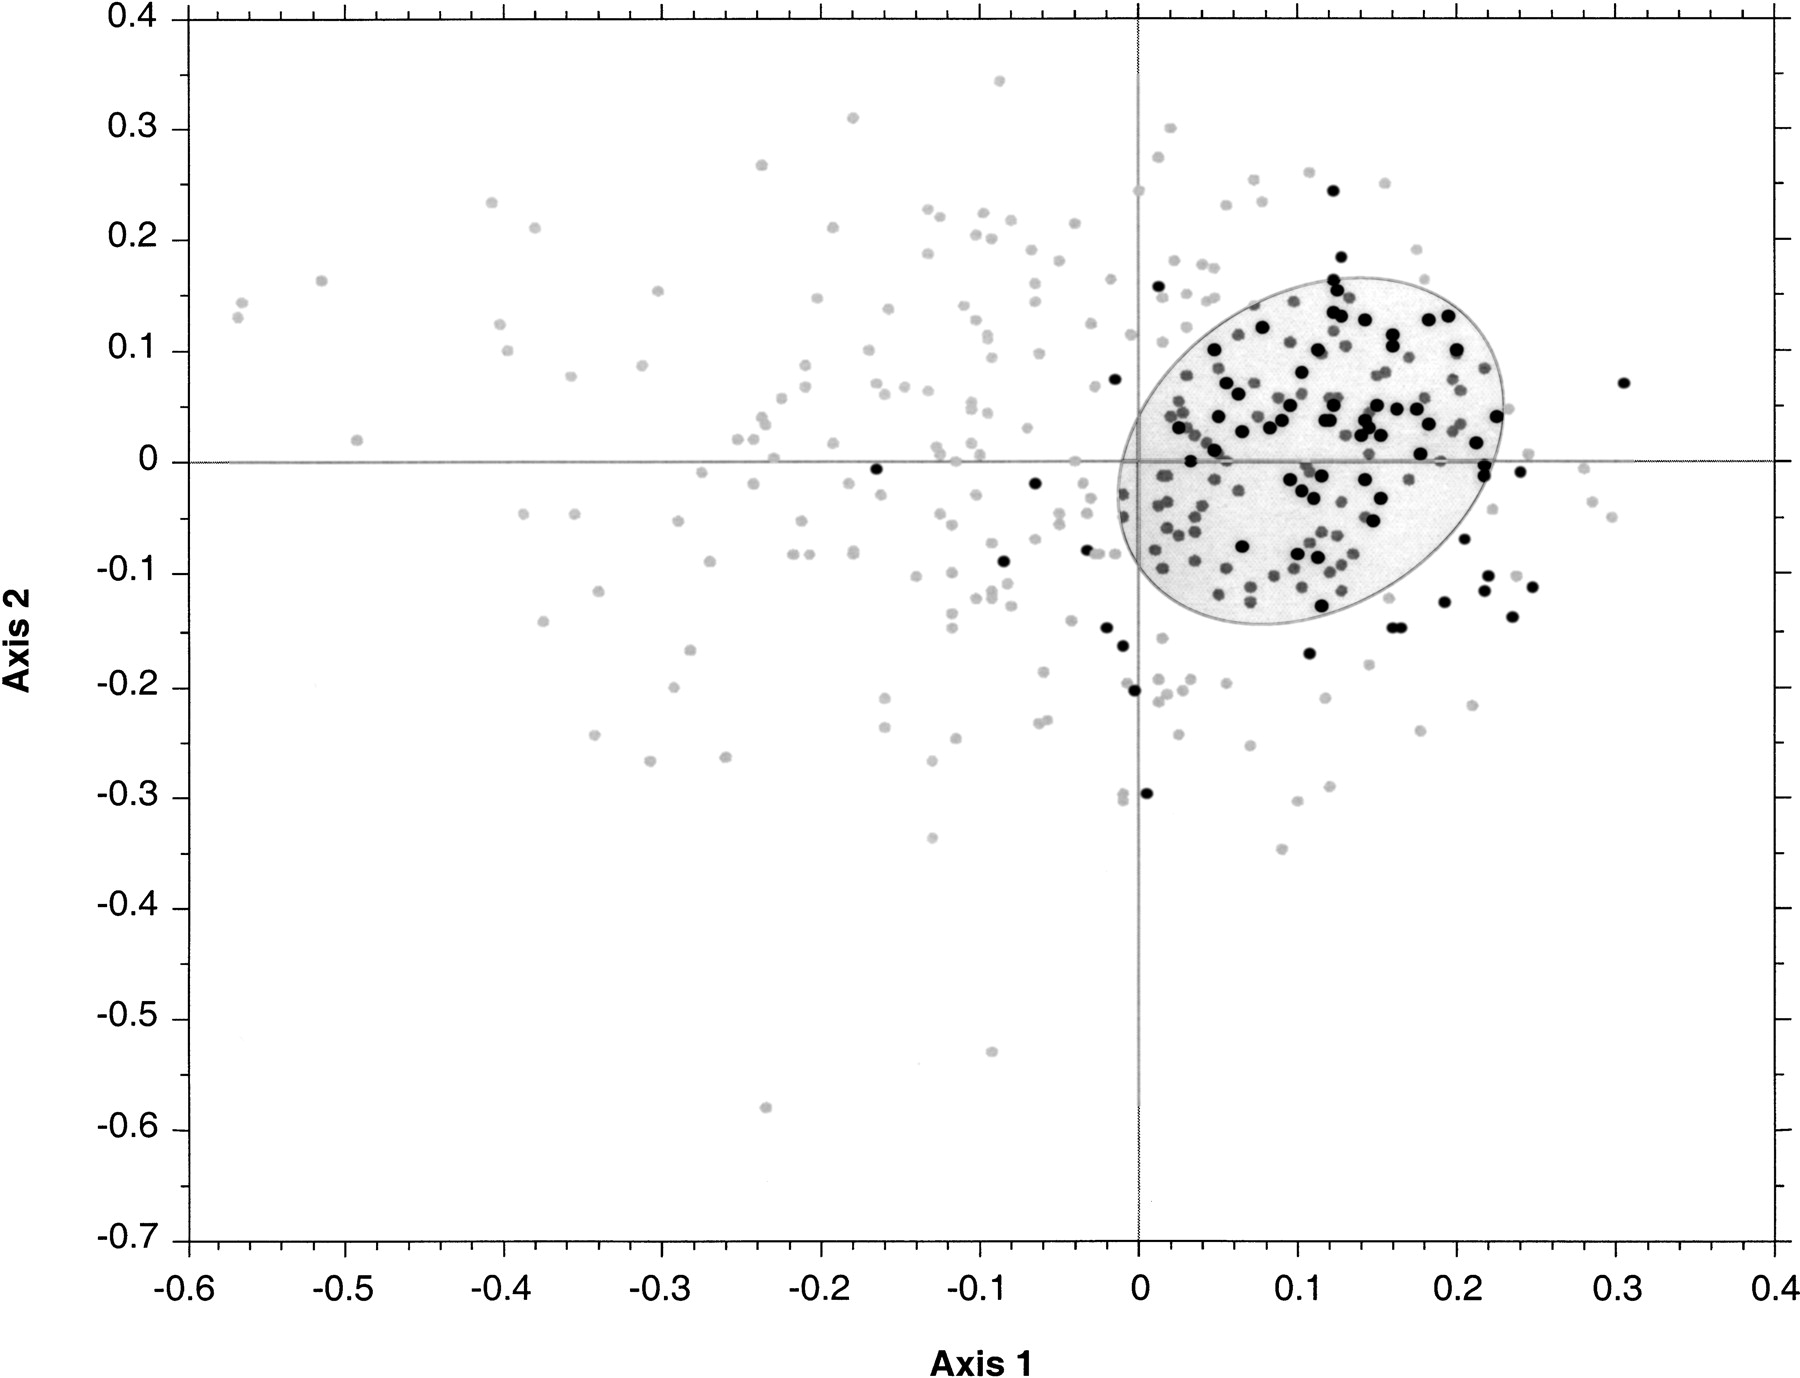
Figure 3.
Plot of the two first axes of the PCO made from 310 BIONJtrees compared with RF distance. The trees chosen contained at least 10 bacterial species. The same experiment with ML-trees gave very similar results. Black dots correspond to informational genes, and gray dots correspond to operational genes. The ellipse contains the 121 trees retained for supertree reconstruction (see Table 1).


