
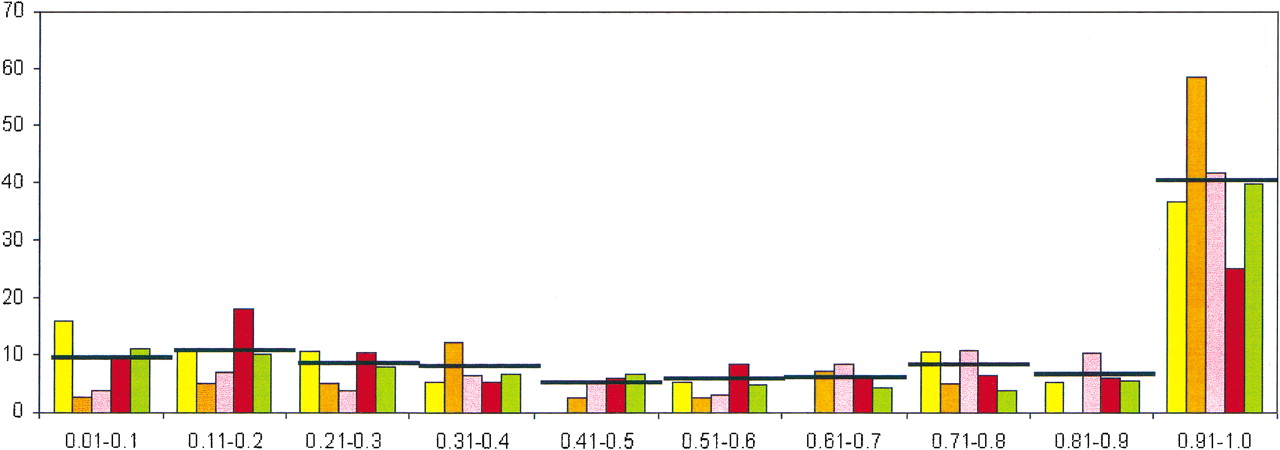
Figure 4.
Distribution of lineage-specific clusters by Expansion Coefficient (EC).The X-axis shows ranges of EC values (see text) and the Y-axis shows the percentage of LSCs within each EC range. (Yellow)Schizosaccharomyces pombe; (orange) Saccharomyces cerevisiae; (pink) Drosophila melanogaster; (red)Caenorhabditis elegans; (green) Arabidopsis thaliana.In each class, the average value of the five species is indicated by a horizontal line.


