
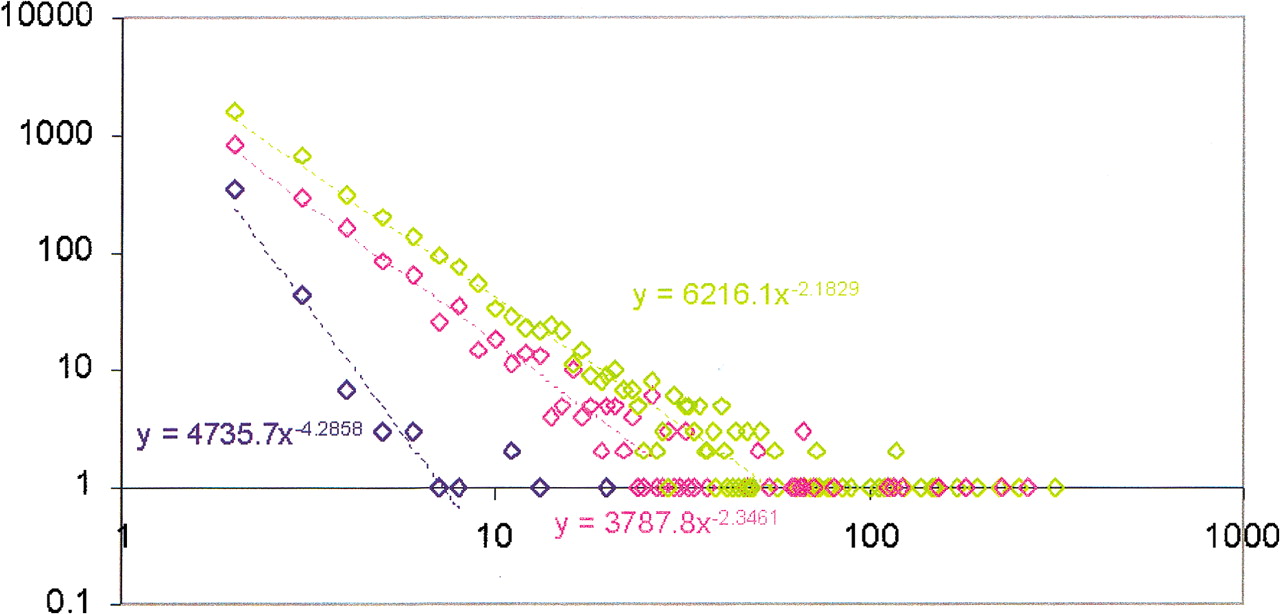
Figure 3.
Size distribution of the lineage-specific clusters in three eukaryotic species. (Blue) Schizosaccharomyces pombe; (pink)Caenorhabditis elegans; (green) Arabidopsis thaliana. Cluster size (X-axis) is plotted against the number of LSCs in double logarithmic coordinates. The equations of the power law distribution fitting the linear part of the data are shown on the graph.


