
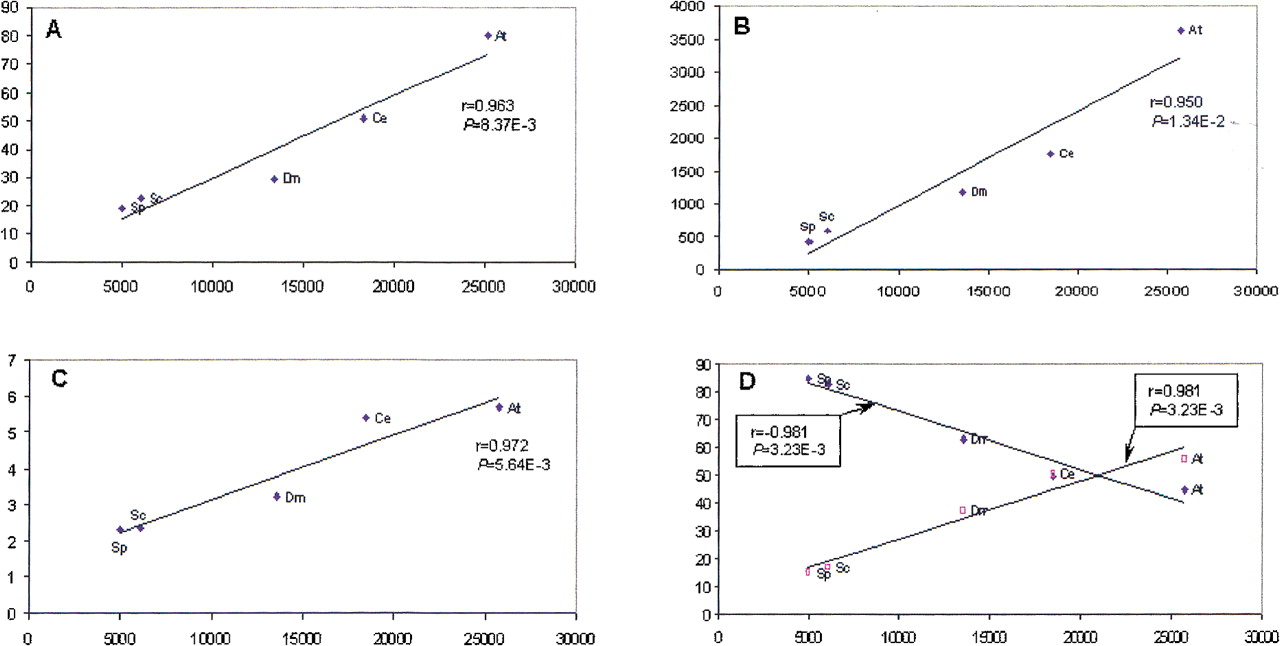
Linear correlation between the proteome size and parameters of eukaryotic lineage-specific expansion (LSE) in five eukaryotic species. Correlation coefficients (r) and significance levels (P) were determined using ordinary least square linear regression. (At)Arabidopsis thaliana; (Ce) Caenorhabditis elegans; (Dm) Drosophila melanogaster; (Sc) Saccharomyces cerevisiae; (Sp) Schizosaccharomyces pombe. (A) The proteome size (X-axis) is plotted against the percentage of the proteome made up of LSEs. (B) The proteome size (X-axis) is plotted against the number of lineage-specific clusters. (C) The proteome size (X-axis) is plotted against the mean number of proteins in lineage-specific clusters. (D) The proteome size (X-axis) is plotted against the percentage of duplication (♦) and the percentage of n-plication (n> = 3) (□) among the LSCs.


