
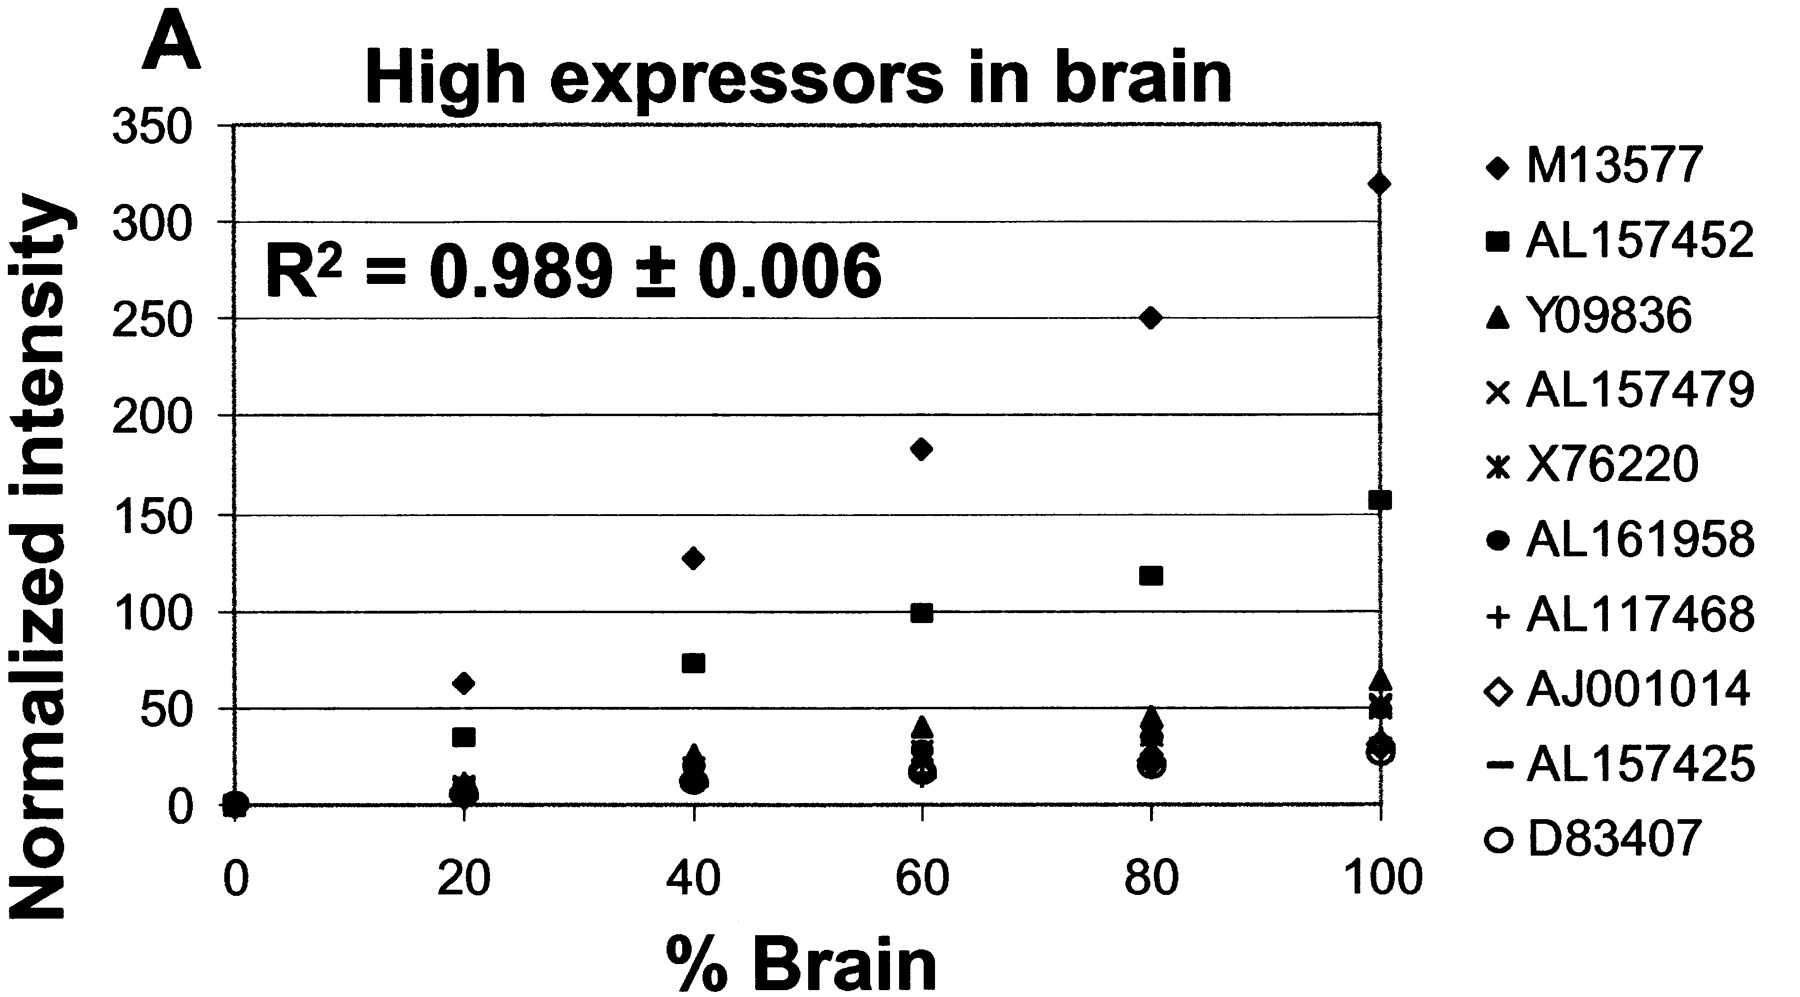
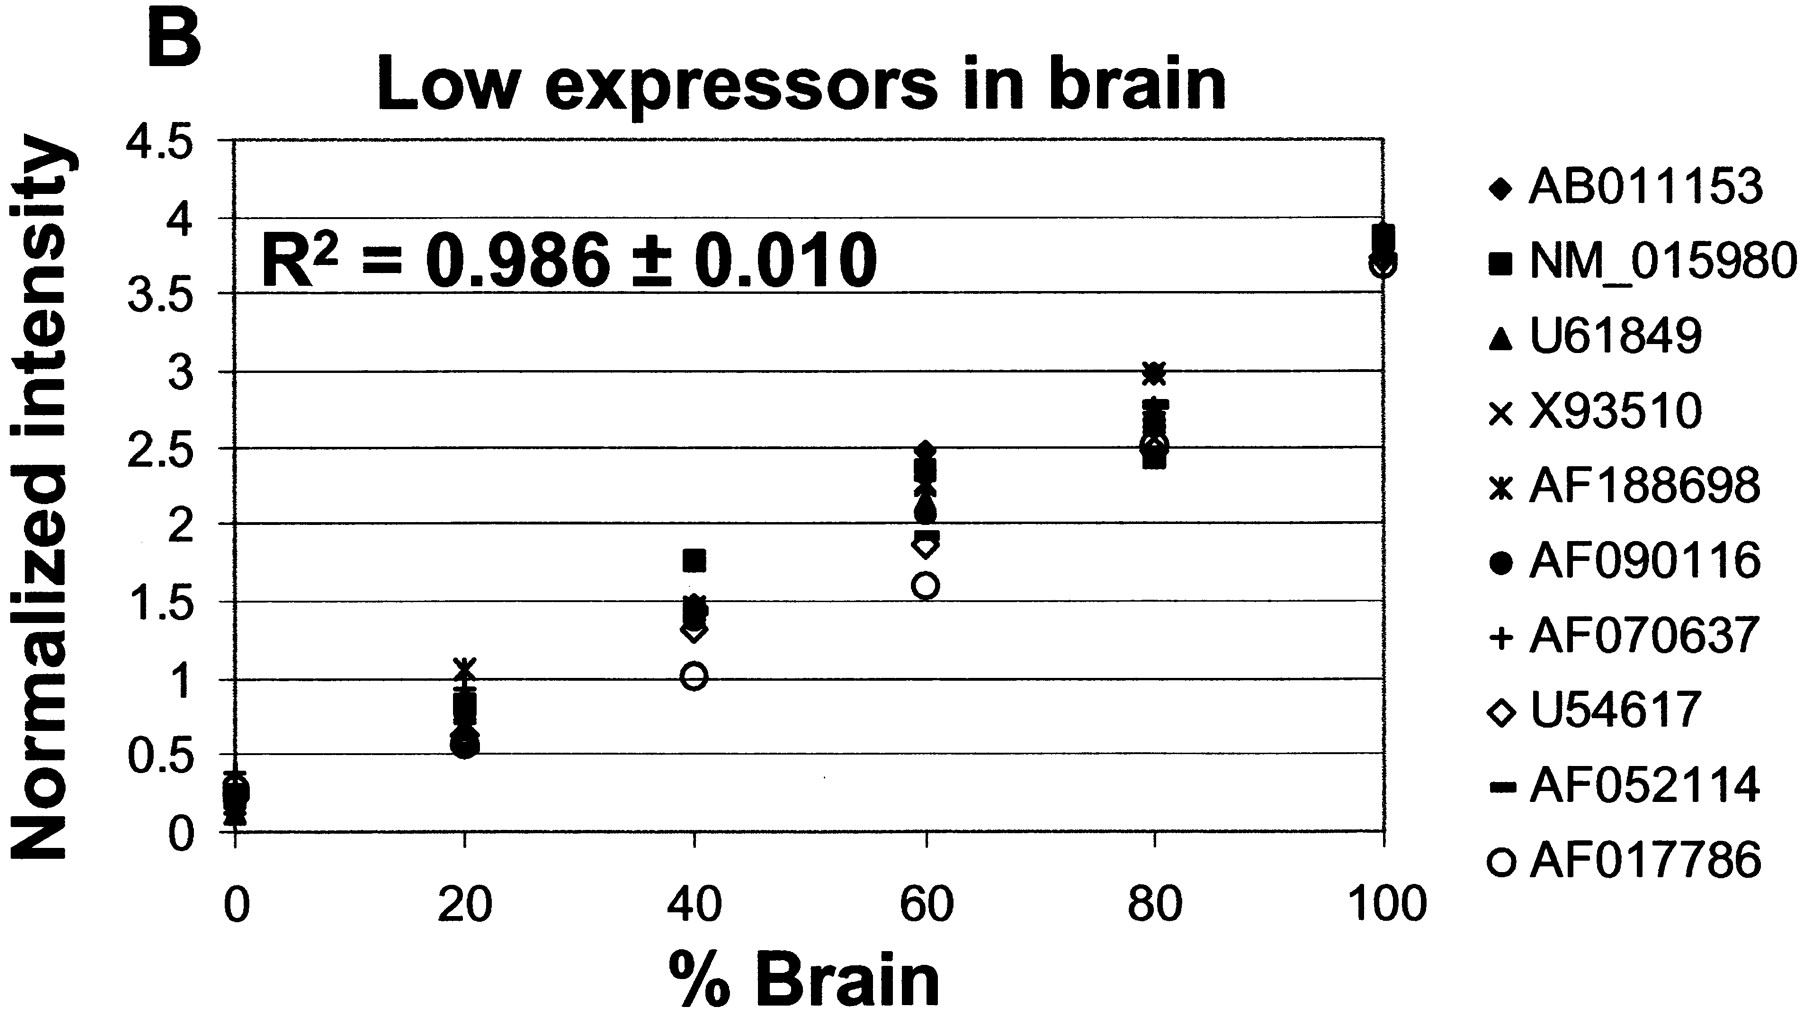
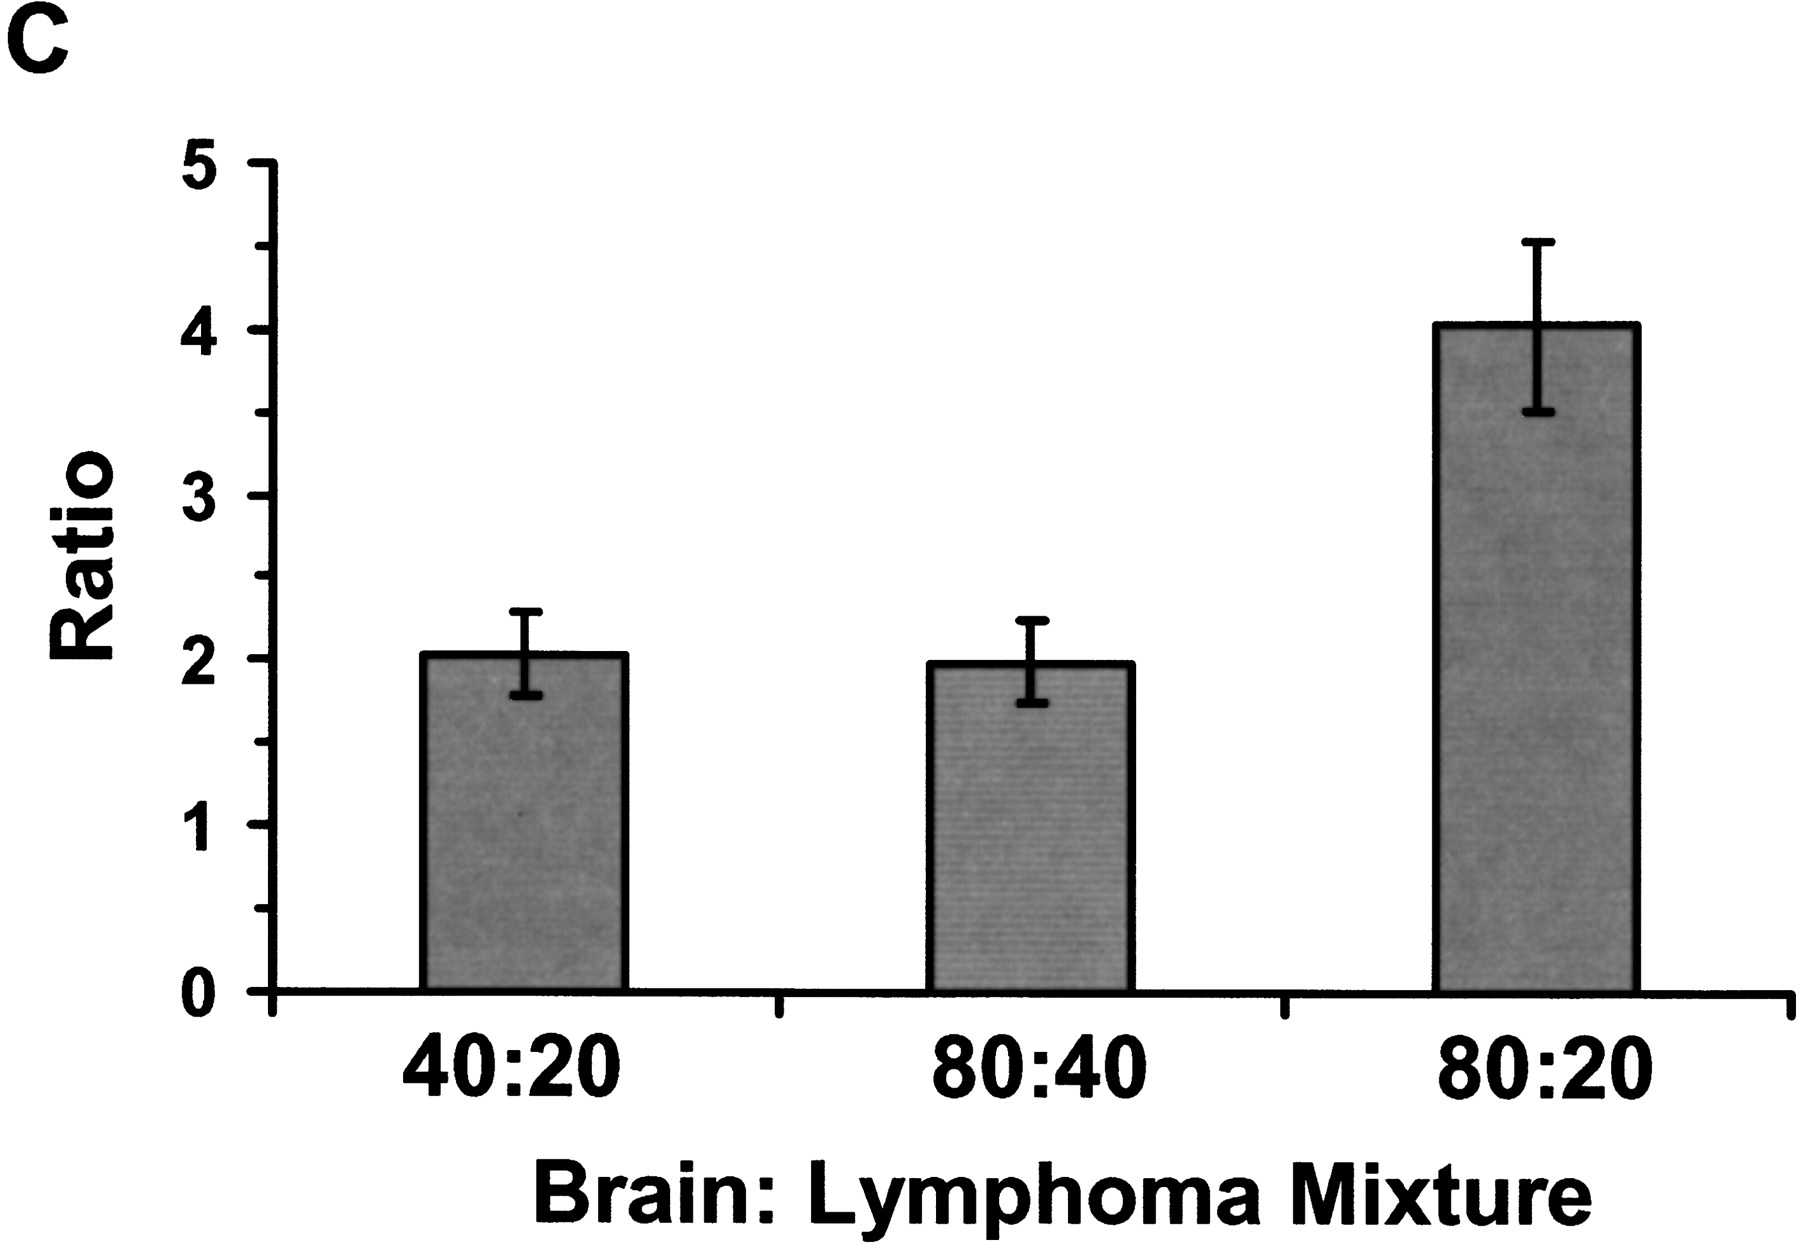
Linearity of amplification. Total RNA from brain and a Burkitt's lymphoma cell line (CA46V1) was mixed at 80:20, 60:40, 40:60, and 20:80 mass:mass ratios, then used to generate aRNA. These aRNA preparations were hybridized in triplicate to Human UniSet I arrays. (A) The average signal intensities for 10 genes expressed at high levels in brain tissue, but not present in lymphoma tissue, are plotted versus the percentage of brain total RNA in the original mixture. The average R 2 value (±SD) for each set of the 10 genes plotted is shown for A andB. (B) The average signal intensities for 10 genes expressed at low levels in brain tissue, but not present in lymphoma tissue, are plotted versus the percentage of brain total RNA in the original mixture. (C) The average brain:lymphoma ratio of the signal from the indicated mixture for the 150 highest expressed genes in brain that are not expressed in the Burkitt's lymphoma cell line. The error bars represent the standard deviation.


