

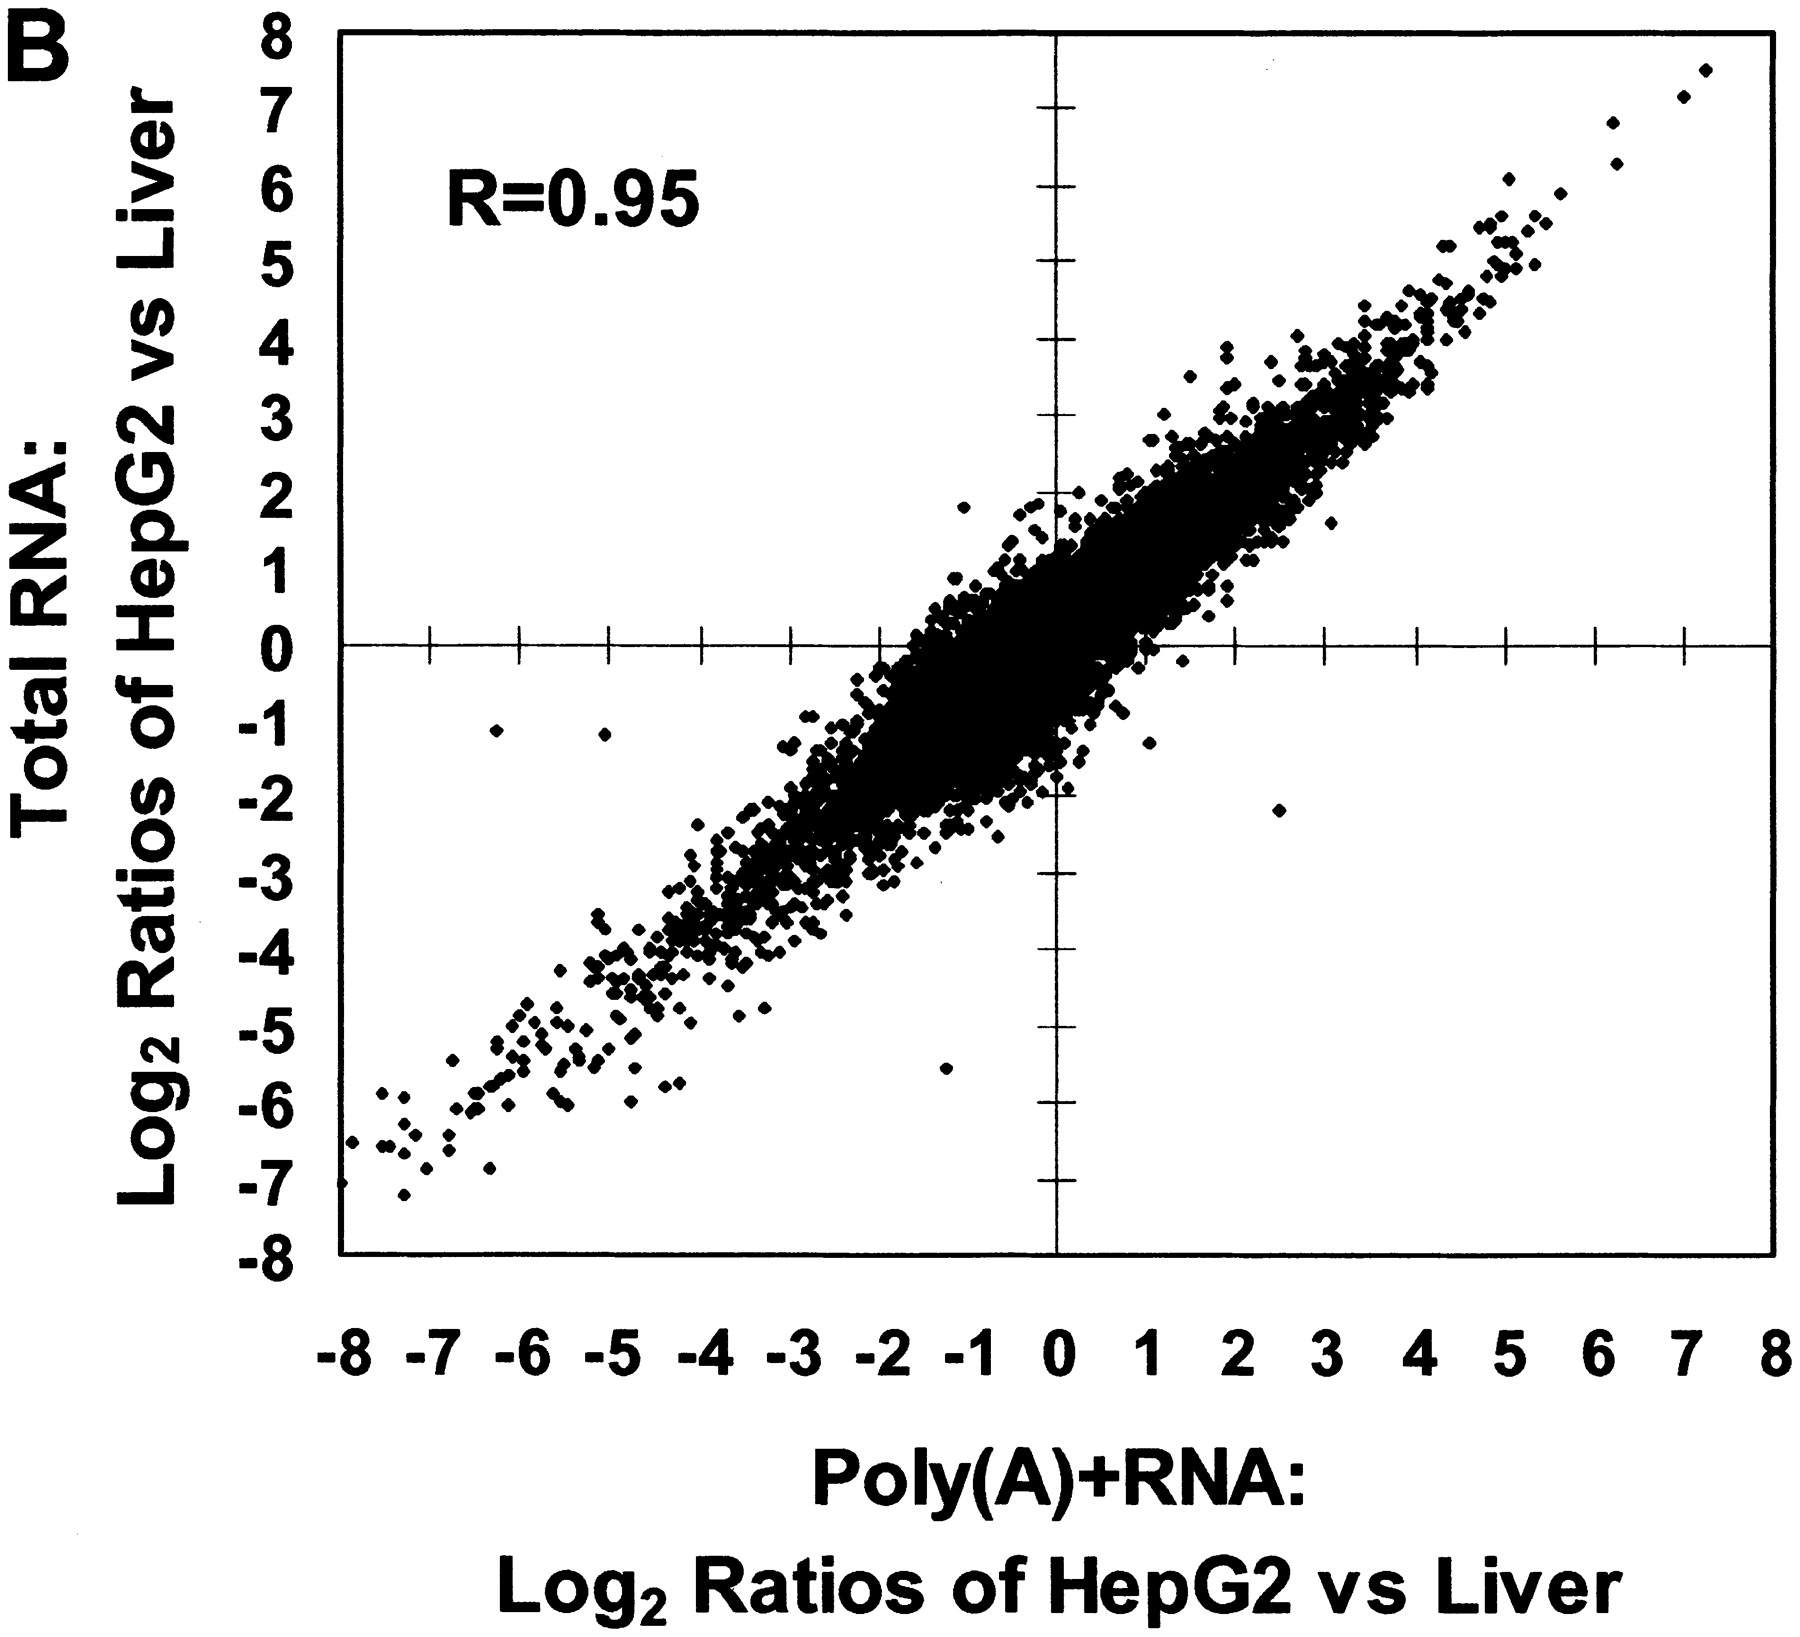
Total RNA versus poly(A)+ RNA. Poly(A)+ RNA was enriched from a portion of a large pool of total RNA isolated from a single liver sample or from HepG2 cells. Multiple aRNA preparations were generated from both the poly(A)+ RNA and total RNA samples and hybridized to Human UniSet I microarrays in duplicate. (A) The microarray results are included in the hierarchical clustering diagram shown in Figure 4, which is shown in more detail here to highlight the comparison of aRNA prepared from poly(A)+ RNA. (B) The logarithm (base 2) of the differential expression ratios of HepG2 versus liver are plotted for total RNA compared with poly(A)+ RNA. Every ratio measured is plotted from a single microarray per condition (4 aRNA preparations and 4 microarrays total). The correlation coefficient (R) was calculated to be 0.95.


