
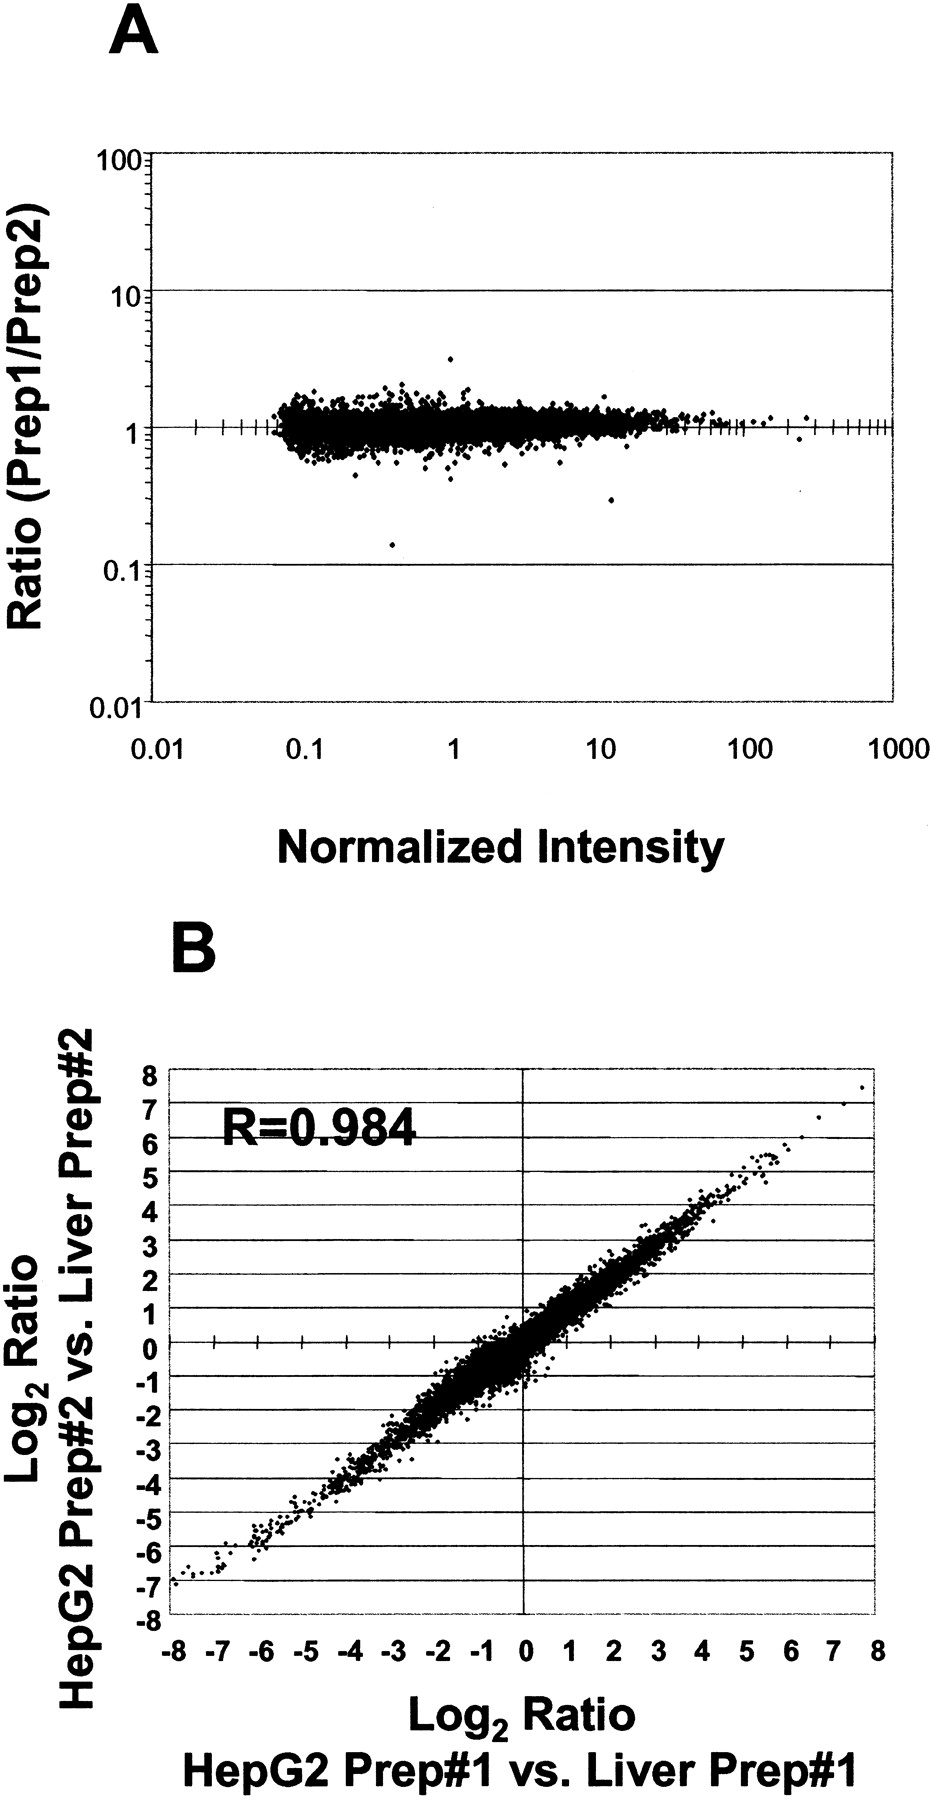
Figure 3.
Target preparation variability. (A) aRNA target was prepared in two separate reactions from 5 μg of HepG2 total RNA, then hybridized to independent microarrays. The ratio of the signal intensity for each gene between preparations is plotted versus the signal intensity. (B) The signal intensities for each gene obtained from two aRNA target preparations in A were compared with two separate aRNA target preparations from the same liver total RNA sample (5 μg of input total RNA). The logarithm (base 2) ratio correlation would be equal to 1.0 if the target preparations and arrays were perfect.


