
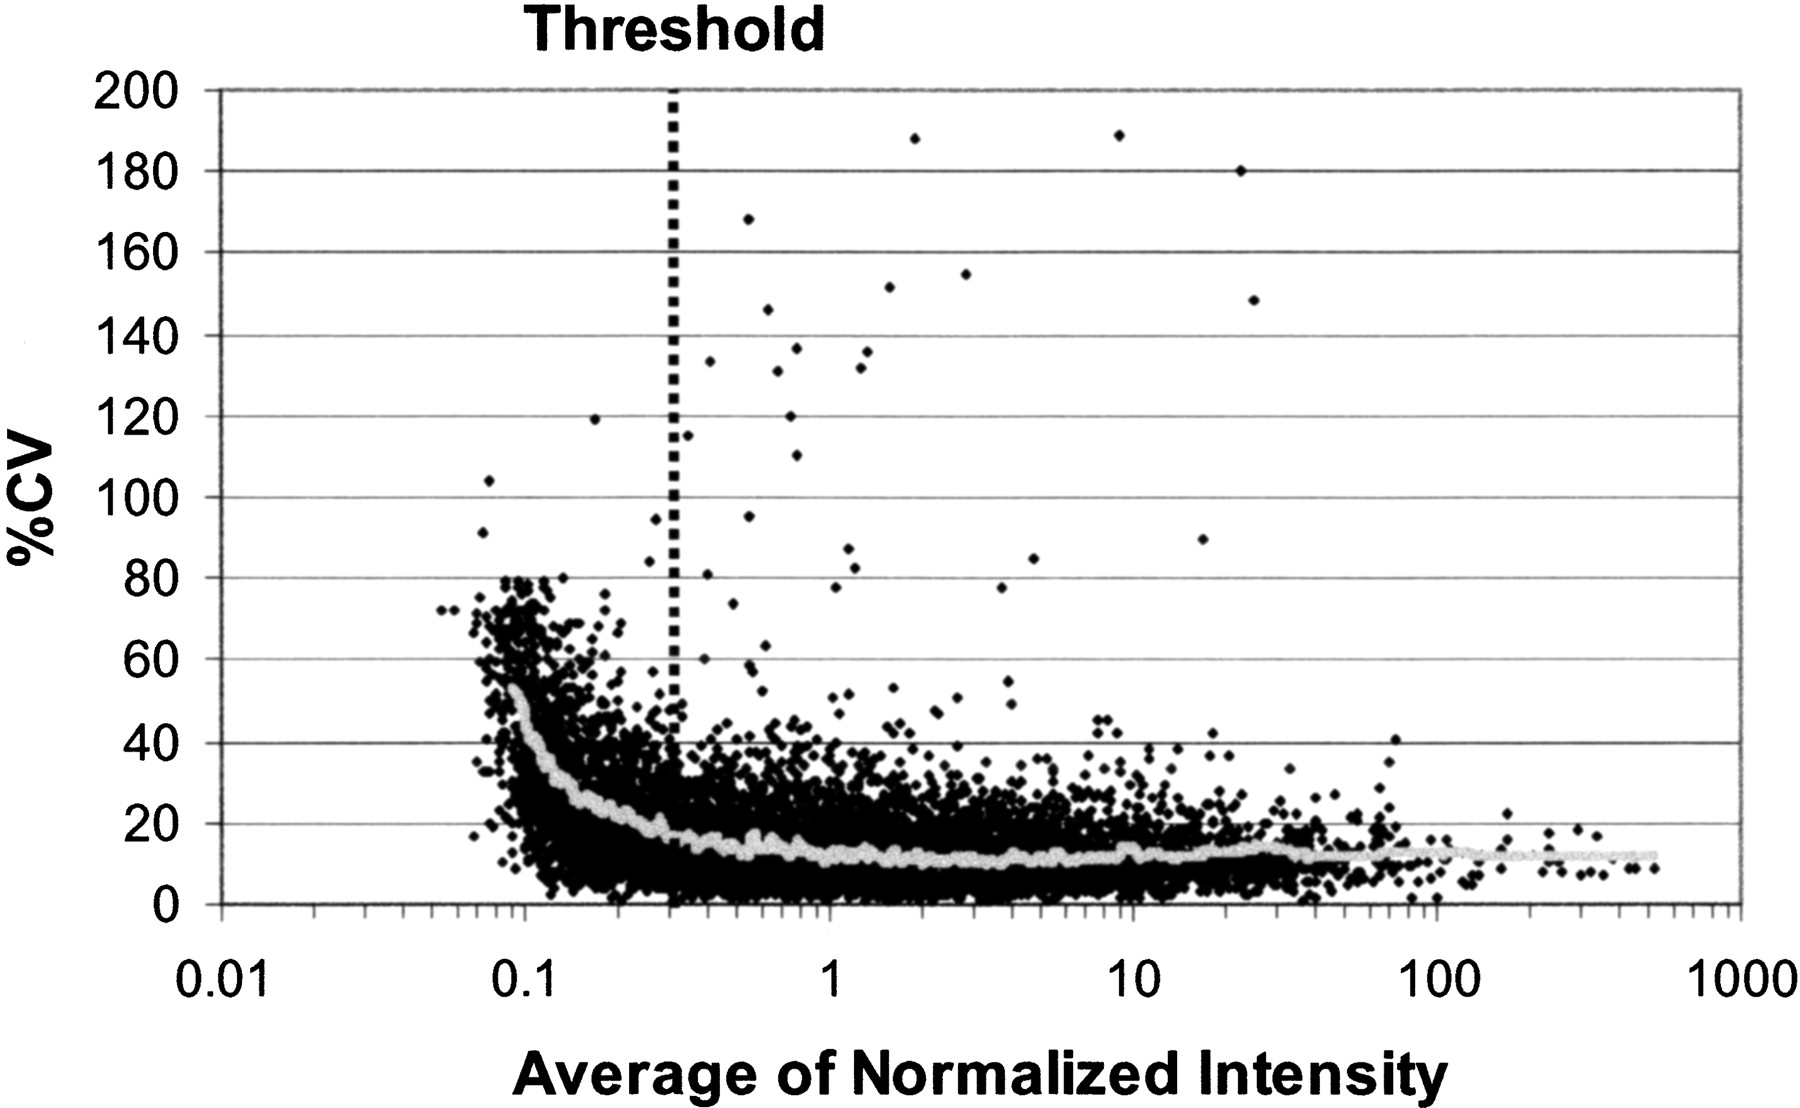
Figure 2.
CV versus signal intensity graph. Four separate target preparations were hybridized to Human UniSet I slides and the coefficient of variation (CV) was plotted versus the mean signal intensity for each gene. The 100-point moving trend line shows that the average variability is low throughput the signal range. The average threshold, which represents the mean signal intensity plus 3 times the standard deviation for a set of bacterial control probes, is shown in red.


