
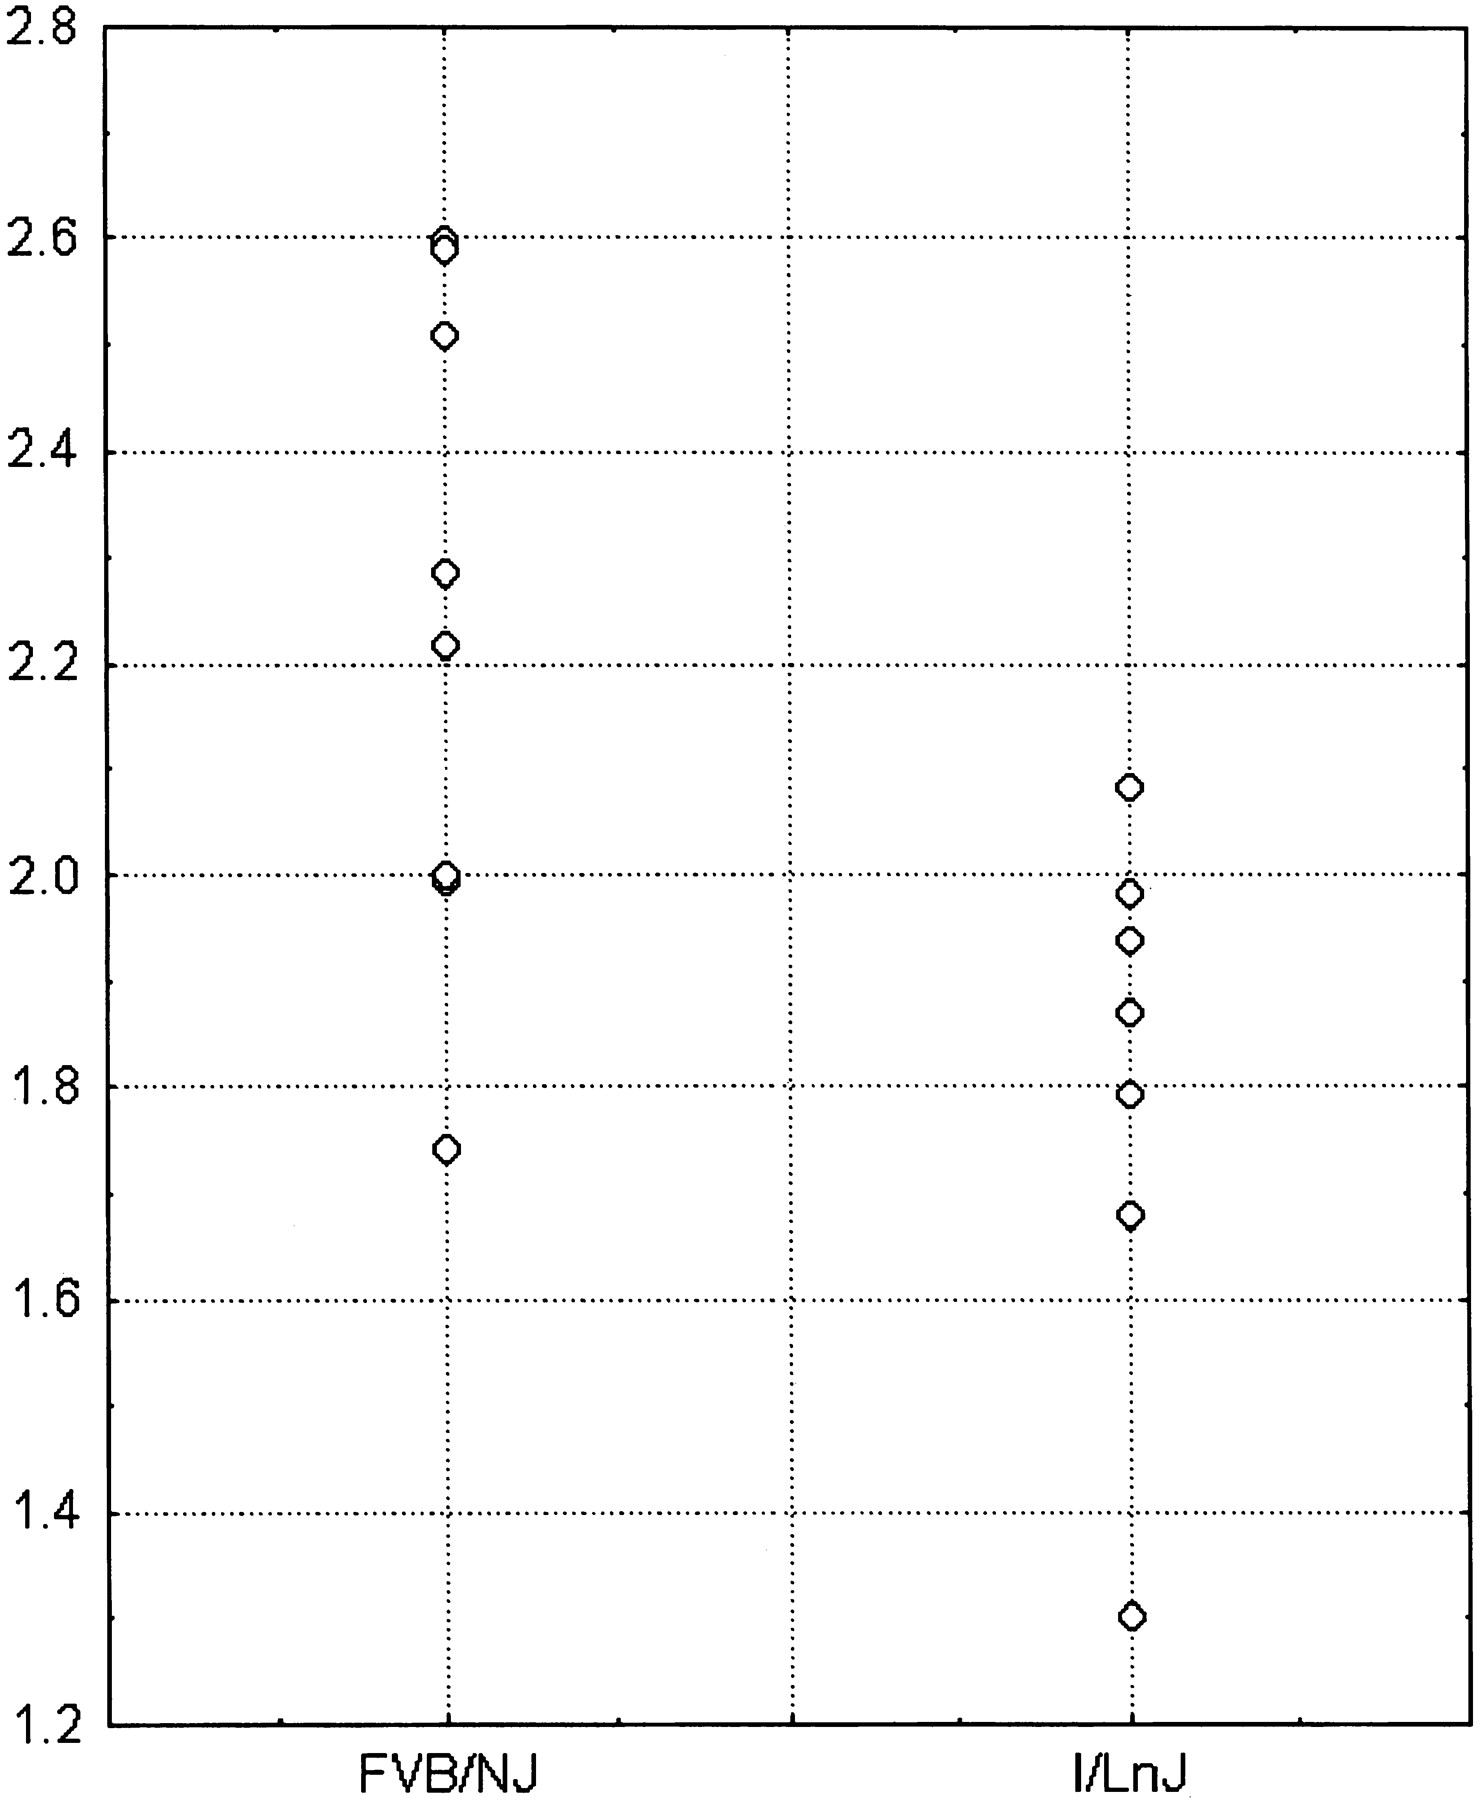
Figure 2.
Scatterplot of the Expression Chip c-Myc results. The FVB/NJ homozygous results are displayed at left and the [I/LnJ x FVB/NJ]F1 results at right. The data is presented as the ratio of the c-Myc expression of the samples versus the reference RNA.


