
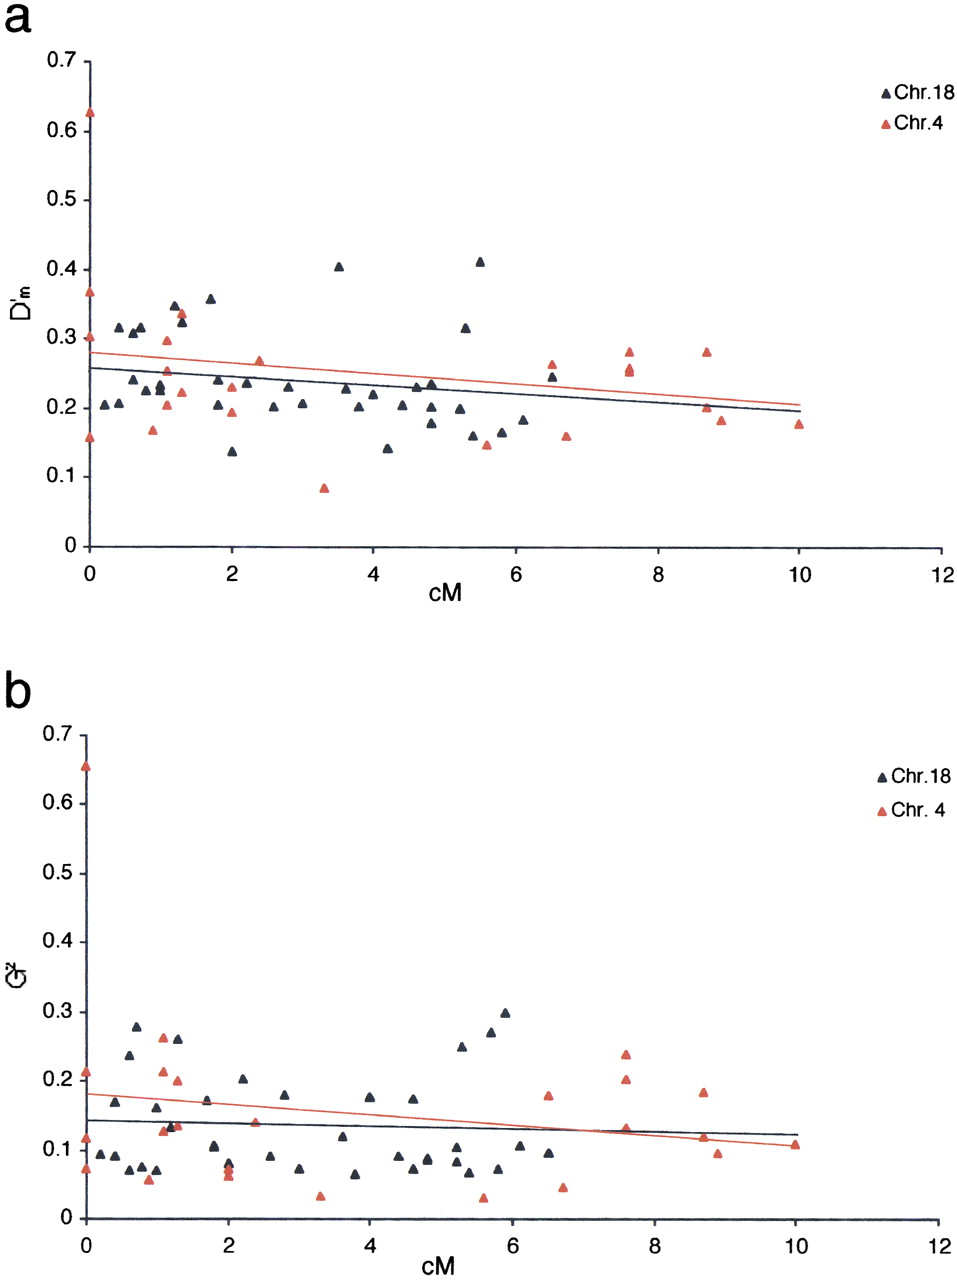
Figure 2.
Comparison of the strength of linkage disequilibrium (LD) on chromosomes 18 and 4 in the Afrikaners. Multiallelic D‘m(a) and G2 (b) are plotted against genetic distance (cM). Each point represents one pair of markers. Solid lines are linear regression best fit lines.


