
Figure 1.
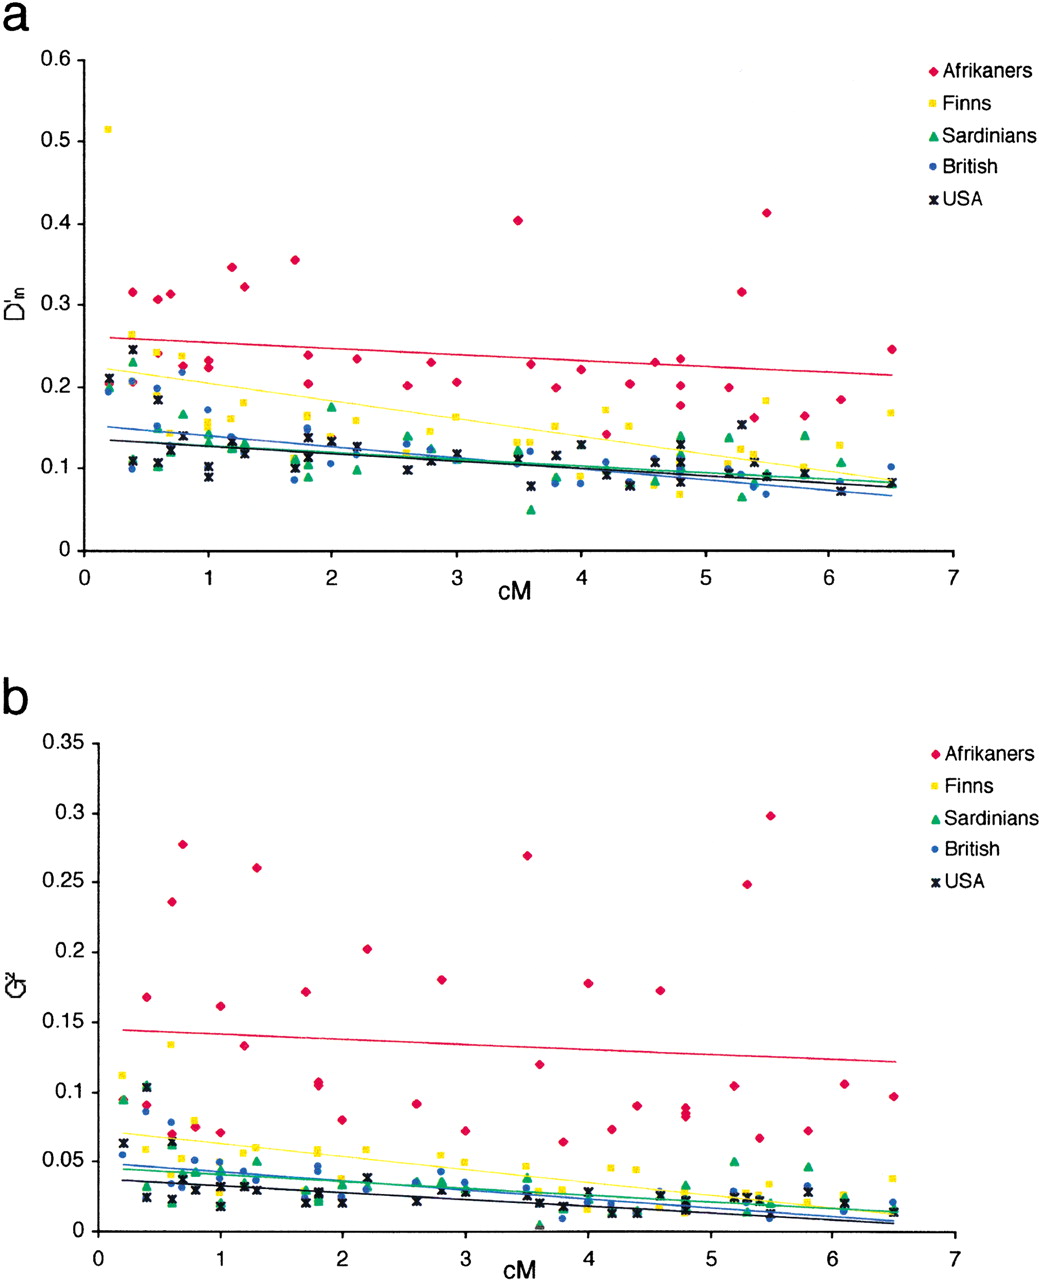
Relationship between multiallelic D‘m (a) and G2 (b) values and genetic distance (cM) across populations. Solid lines are linear regression best fit lines.
(Downloading may take up to 30 seconds. If the slide opens in your browser, select File -> Save As to save it.)
Click on image to view larger version.
Relationship between multiallelic D‘m (a) and G2 (b) values and genetic distance (cM) across populations. Solid lines are linear regression best fit lines.
 CiteULike
 Delicious
 Digg
Digg Facebook
 Google+
 Reddit
 Twitter
