
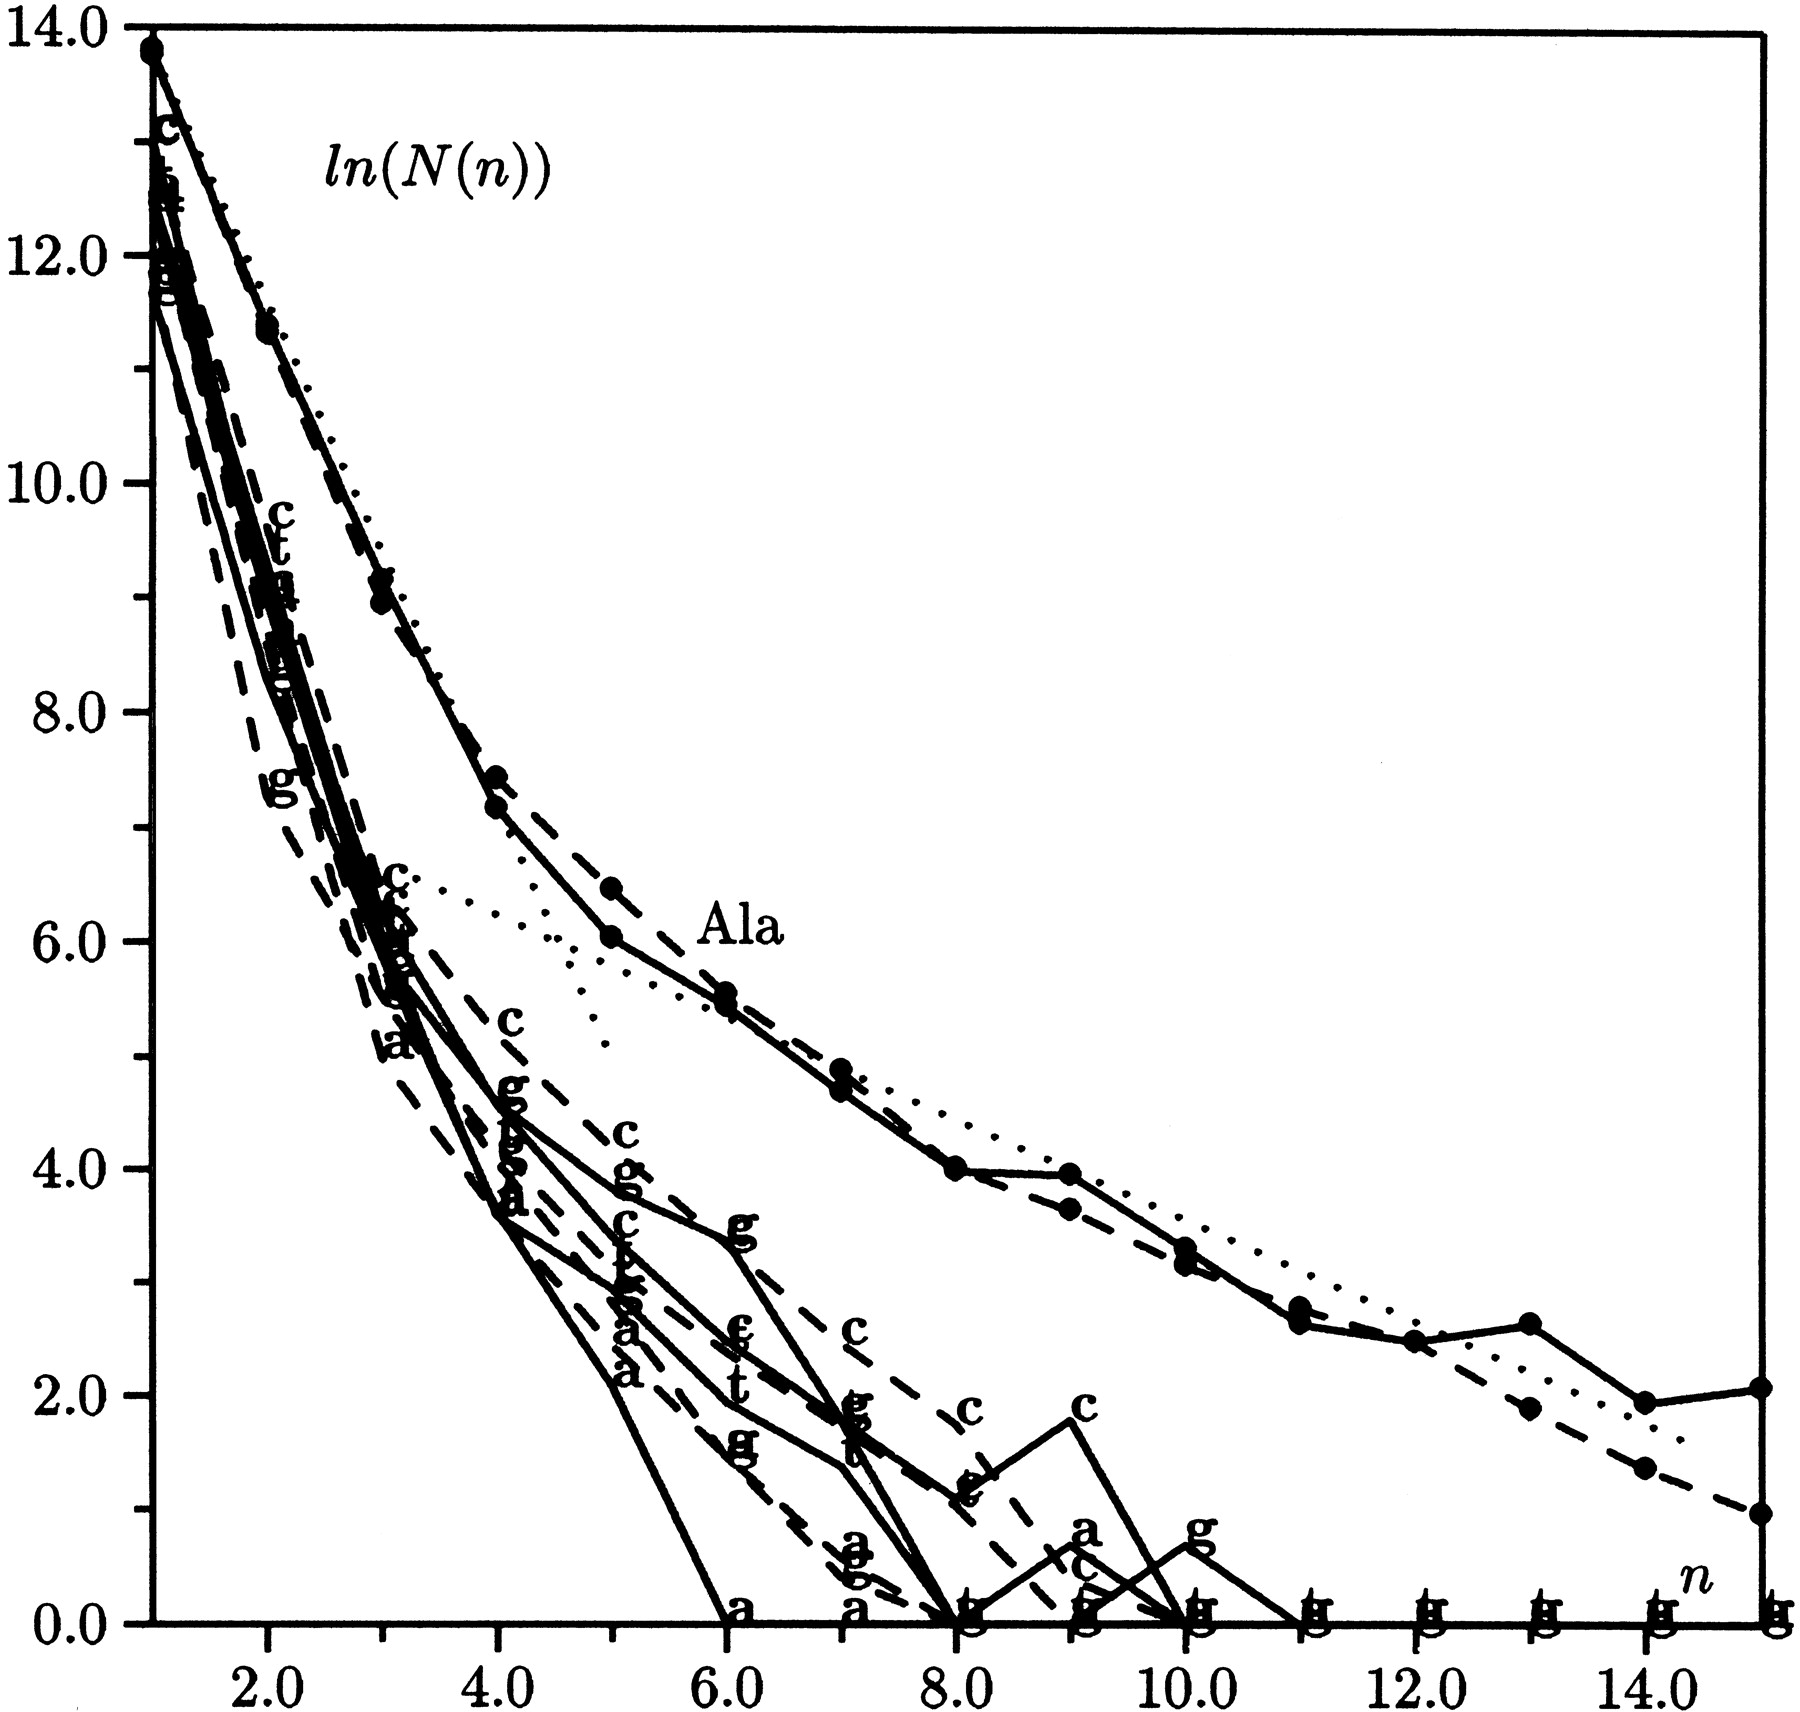
Figure 3.
Histograms representing the abundance of runs of the four alanine codons and of alanine itself. Full lines represent the results of the counts performed on natural sequences; dashed lines are the simulation results. The uppermost histogram belongs to the alanine runs on the amino acid scale. The two dotted lines represent the linear fit of the two parts of the alanine histogram. The letters a, c, g, and t mark the histograms of gca, gcc, gcg, and gct codons, respectively. Note that the gcg codon, which only accounts for 10% of alanines, is accordingly low and descends steeply at n < 5, only becoming the most persistent at high n values.


