
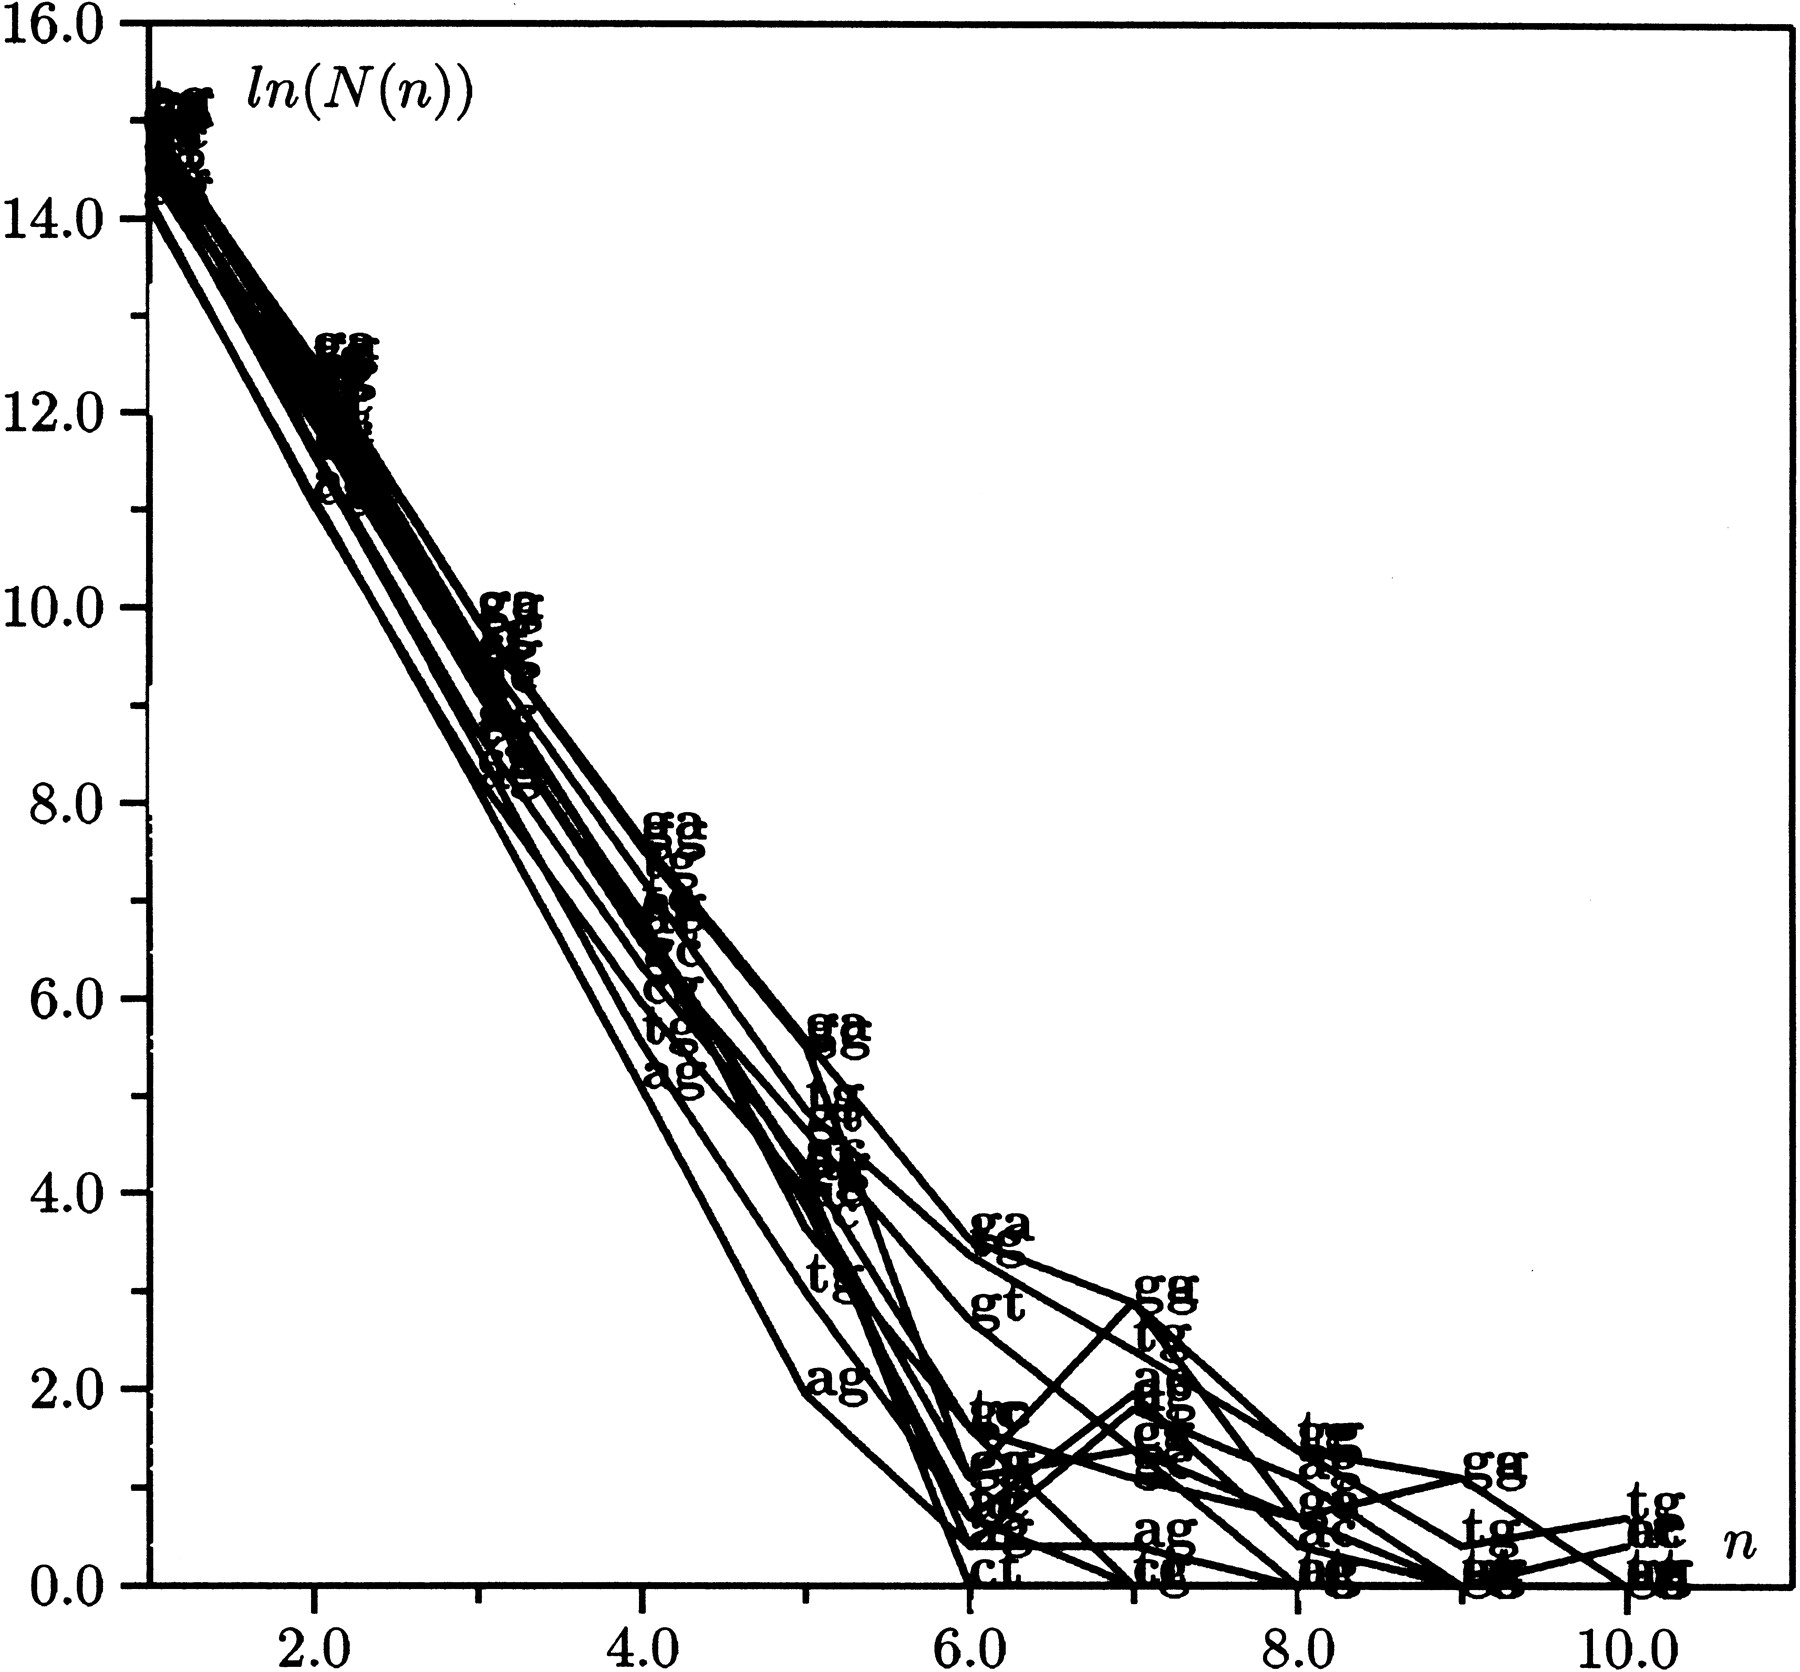
Figure 2.
Histograms displaying the frequency of 12 heterodinucleotide repeats in exons. At the bottom right part of the diagram, a minimal degree of repeat enrichment is observed. The upper left part of the diagram shows the standard decay of the frequency of dinucleotides as predicted by the Bernoulli model.


