
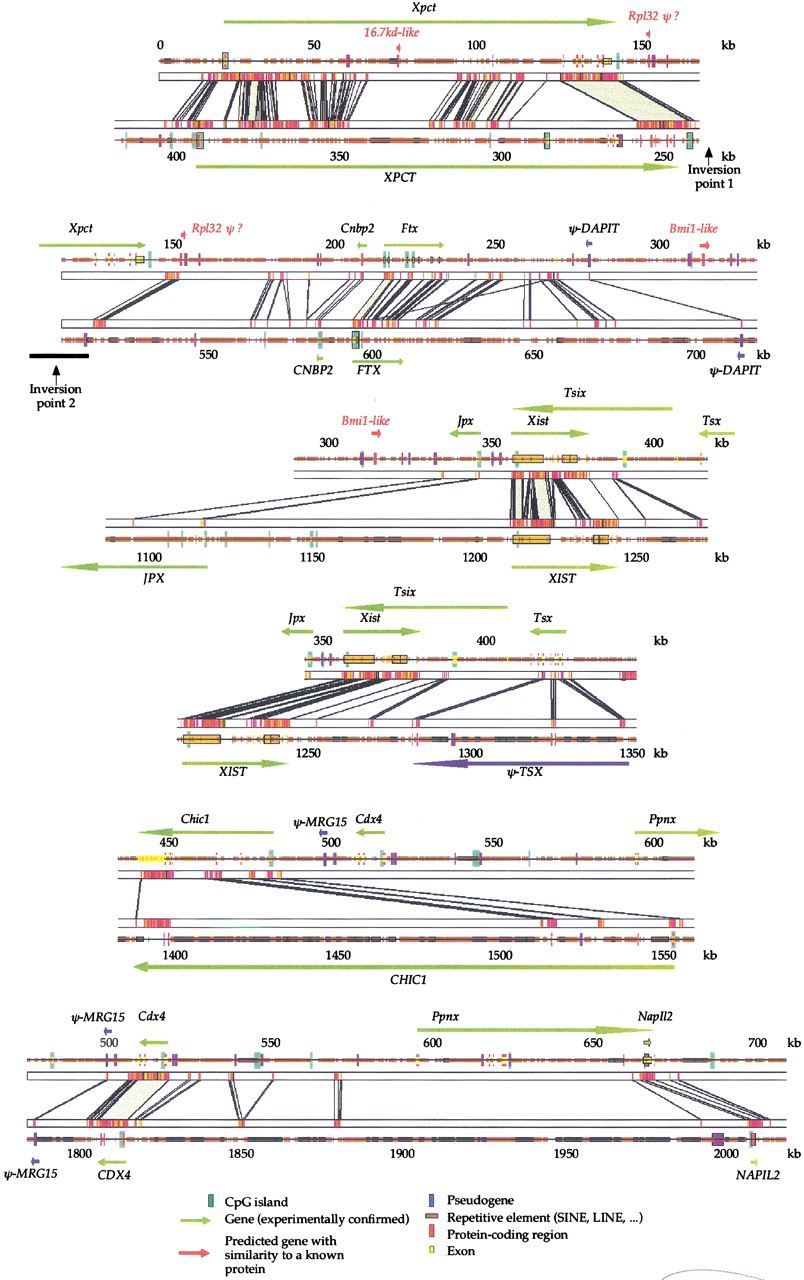
Comparison of mouse and human genomic sequences in Xic region. Genomic sequences were first analyzed with RepeatMasker to identify and mask repeated elements and then aligned withSIM. Conserved blocks with a similarity score >30 are displayed (see Methods). An electronic version of this figure is available at http://pbil.univ-lyon1.fr/datasets/Xic2002/data.html. Because the alignment is very long and because of an inversion of theXpct gene, it was not possible to display the whole human–mouse comparison in a single continuous line. The alignment, therefore, is displayed in six overlapping fragments. The overlaps are designed to allow the continuity of the fragments to be better appreciated.


