
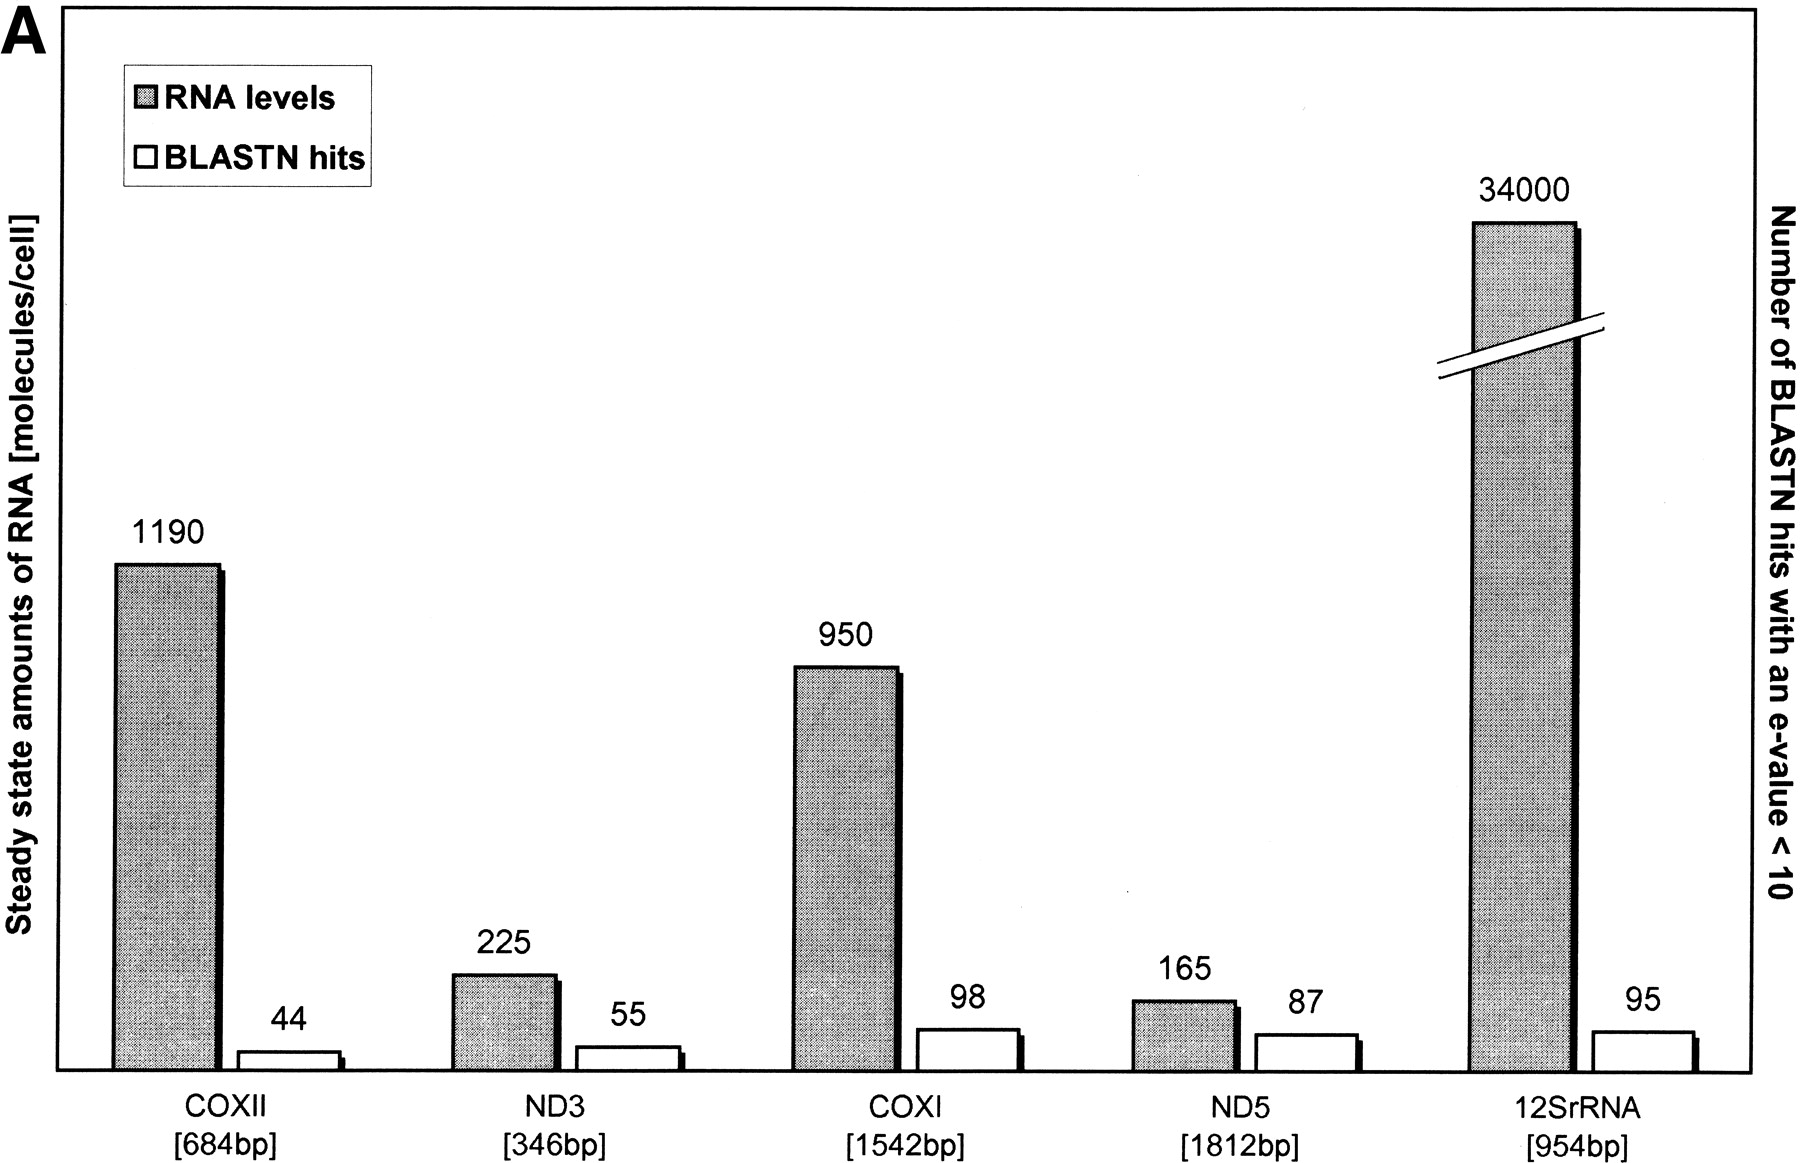
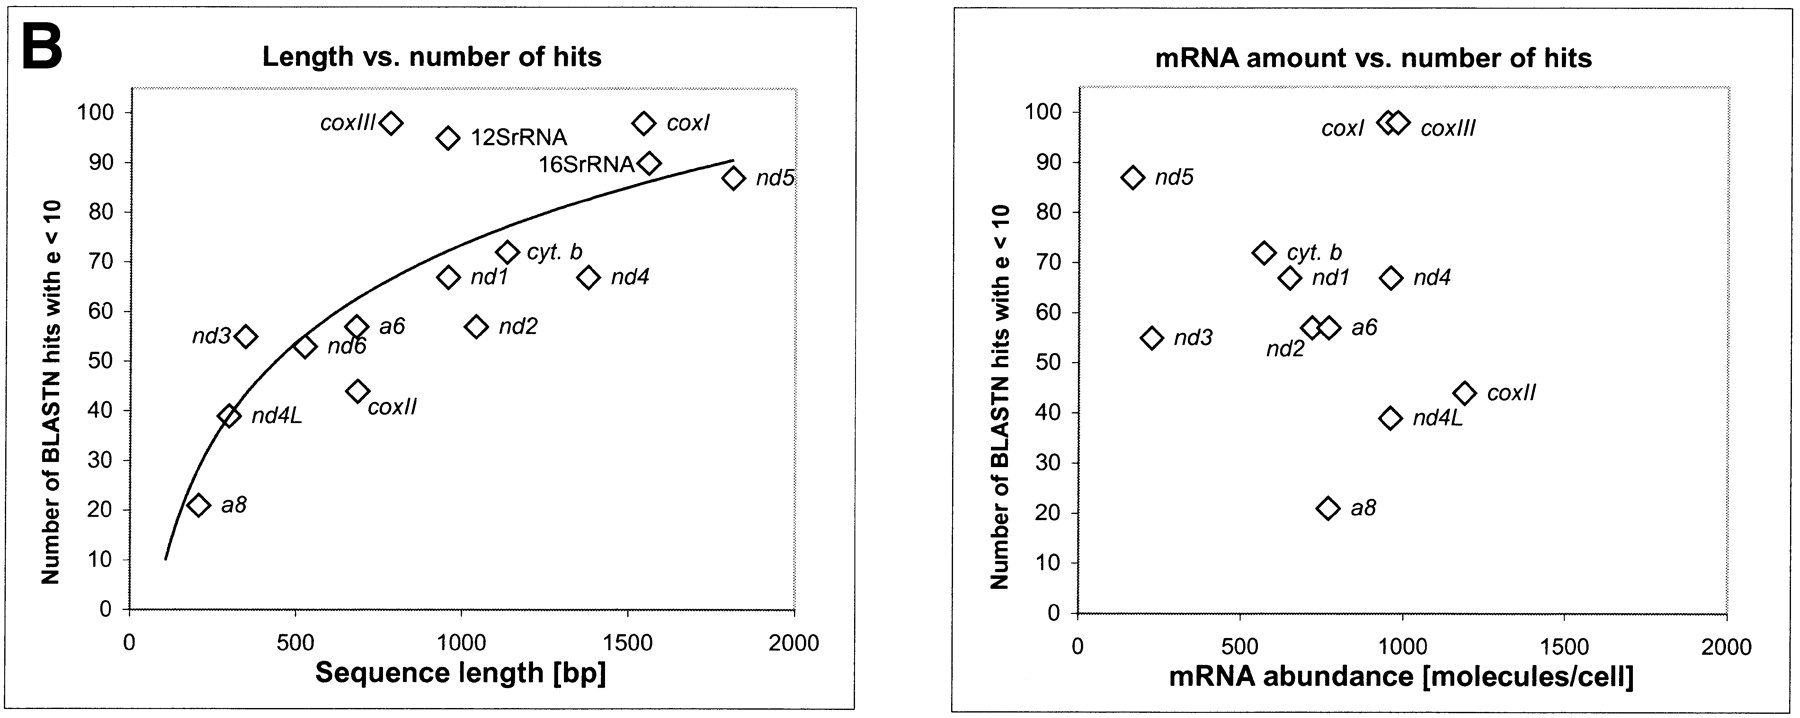
(A) Comparison of steady-state amounts of mitochondrial RNA and the occurrence of the corresponding pseudogene in the nuclear genome. Shown are the steady-state amounts of certain mitochondrial mRNA species and of 12S rRNA (Attardi et al. 1990) and the number ofBLAST hits with an e-value <10 for that particular gene. The correlation coefficients are r = 0.87 (hits/sequence length), and r = −0.18 (hits/mRNA abundance). (B) Comparison of steady-state levels of mitochondrial mRNA and the occurrence of the corresponding pseudogene in the nuclear genome. The left chart illustrates the correlation between sequence length and the number ofBLAST hits above a given threshold, with the correlation coefficient being r = 0.74. Each data point represents one of the 15 sequences of the mtDNA, including the rRNAs. On the rightchart, the same number of BLAST hits as on theleft chart is plotted against the steady-state levels of mitochondrial mRNA (mRNA data from Attardi et al. 1990); correlation coefficient is r = −0.11.


