
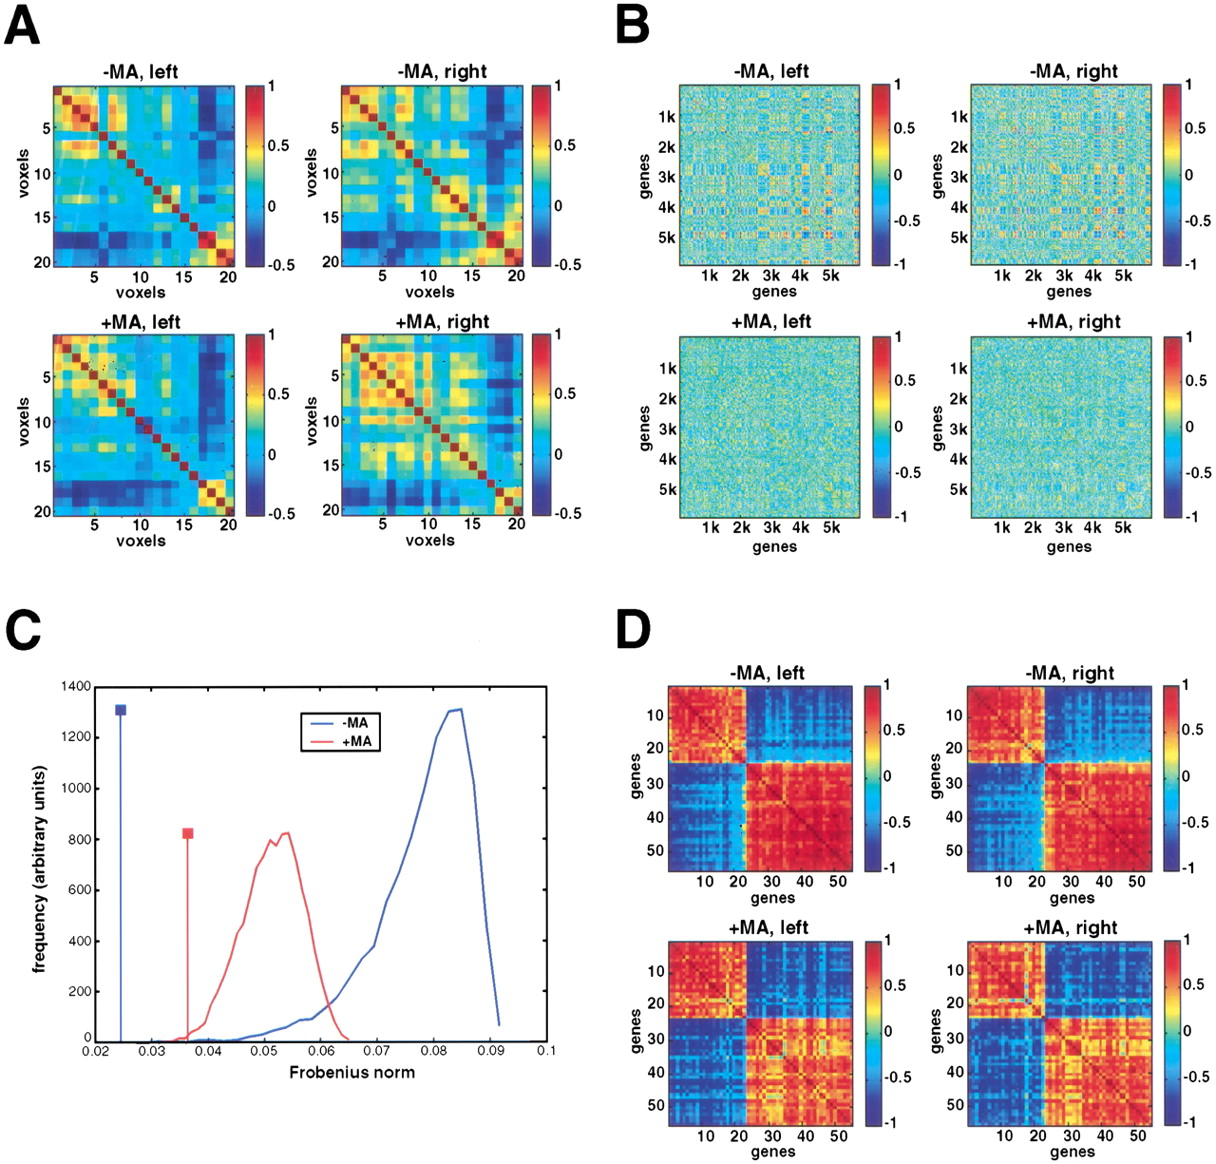
Correlation matrices. (A) Spatial (voxel × voxel) correlation analyses using genes significantly differentially expressed between the anterior and posterior halves of the brain. The matrices for the normal and PD brain are shown with the data for the left and right halves separated out. The correlation between any pair of voxels as judged by gene expression levels is read by looking along the relevant row and column, and finding the intersection. The color of the corresponding element gives the correlation between that pair of voxels by reference to the scales (right). The diagonals are the autocorrelations of the gene expression patterns for each gene and are (and should be) equal to 1. All other correlations must be between 1 and −1. The numbering is such that voxels A2, A4, …, I2, I4 correspond to voxels 1, 2, …, 19, 20, respectively for the left halves of the brain, and voxels A1, A2, …, I1, I3 correspond to voxels 1, 2, …, 19, 20 for the right halves. (B) Expression (gene × gene) correlation analyses using the 6000 most strongly expressed genes when averaged across the 40 voxels. The correlation over voxels for any pair of genes is read by looking along the relevant row and column, and finding the intersection. The genes in the normal omnibus matrix (left and right halves combined) were parsimoniously ordered based on a similarity metric. The same gene order was used to construct the corresponding matrix for the MA brain, and the data were then separated into matrices for the left and right halves of the brains. (C) Monte Carlo analysis comparing similarity of gene expression matrices shown in B for left normal with right normal, and left MA with right MA. The distributions for each brain show the discrepancy between randomly selected pairs of permuted matrices quantitated using the Frobenius norm of the resulting difference matrix. The vertical lines show the differences between the actually observed left and right matrices for each brain. For both the normal and MA brains, the similarity of the gene expression matrices between the left and right halves was highly significant (p < 0.0001 for the normal brain; p = 0.005 for the MA brain). (D) Correlation analyses identify conserved networks of highly correlated gene expression clusters. The gene expression correlation matrices show the subset of genes common to both specimens that are anterior/posterior differentially expressed and display a spatial expression correlation coefficient of >0.75 with at least one other gene within the same brain. The genes in the normal omnibus matrix (left and right halves combined) were parsimoniously ordered using a similarity metric, and the same gene order was used to construct the corresponding matrix for the MA brain. The data were then separated into matrices for the left and right halves of the brains. Two mutually exclusive clusters of coregulated genes emerged: cluster 1 (genes 1–23) and cluster 2 (genes 24–55).


