
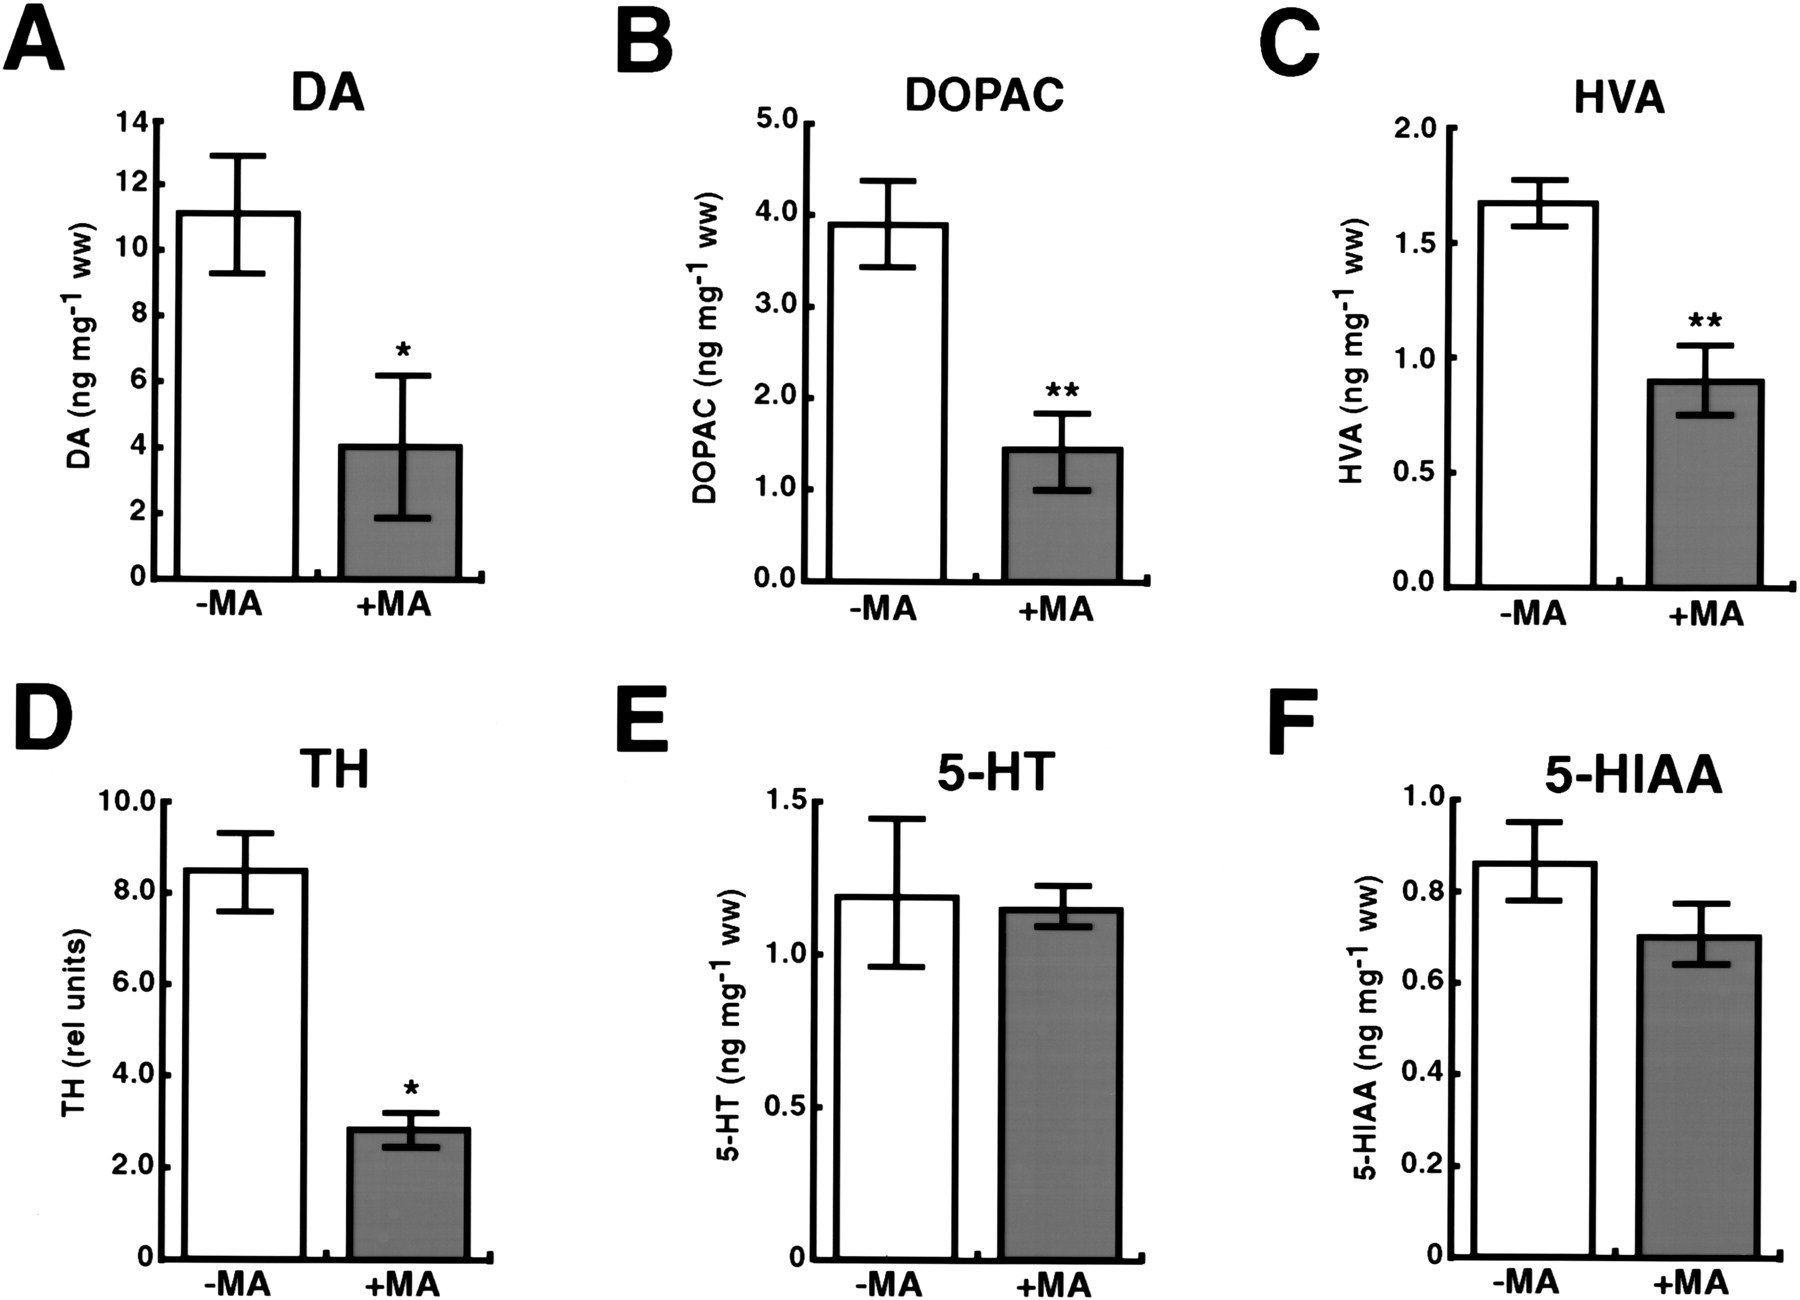
Neurotransmitter and metabolite changes in the MA-treated mice. For all histograms, except D, n = 4 controls, 4 MA-treated. The histograms show mean ± SEM, (**)p < 0.01, (*) p < 0.05. (A) Changes in striatal dopamine. One-tailed t-test, t = 2.53, df = 6, p = 0.02. (B) Changes in striatal dihydroxyphenylacetic acid (DOPAC). One-tailed t-test,t = 3.97, df = 6, p = 0.004. (C) Changes in striatal homovanillic acid (HVA). One-tailedt-test, t = 3.84, df = 6, p = 0.004. (D) Changes in substantia nigra tyrosine hydroxylase (TH). One-tailed t-test, t = 6.18, df = 2,p = 0.013. The peak levels of substantia nigra THfrom the normal and MA brains, left and right,were estimated from real-time QRT-PCR analysis of voxels G3, G4, H3, and H4 (Fig. 4B). n = 2 controls (left andright), 2 MA-treated (left and right). (E) Changes in striatal 5-hydroxytryptamine (5-HT). Two-tailedt-test, t = 0.139, df = 6, p = 0.89. (F) Changes in striatal 5-hydroxyindoleacetic acid (5-HIAA). Two-tailed t-test, t = 1.44, df = 6,p = 0.20.


