
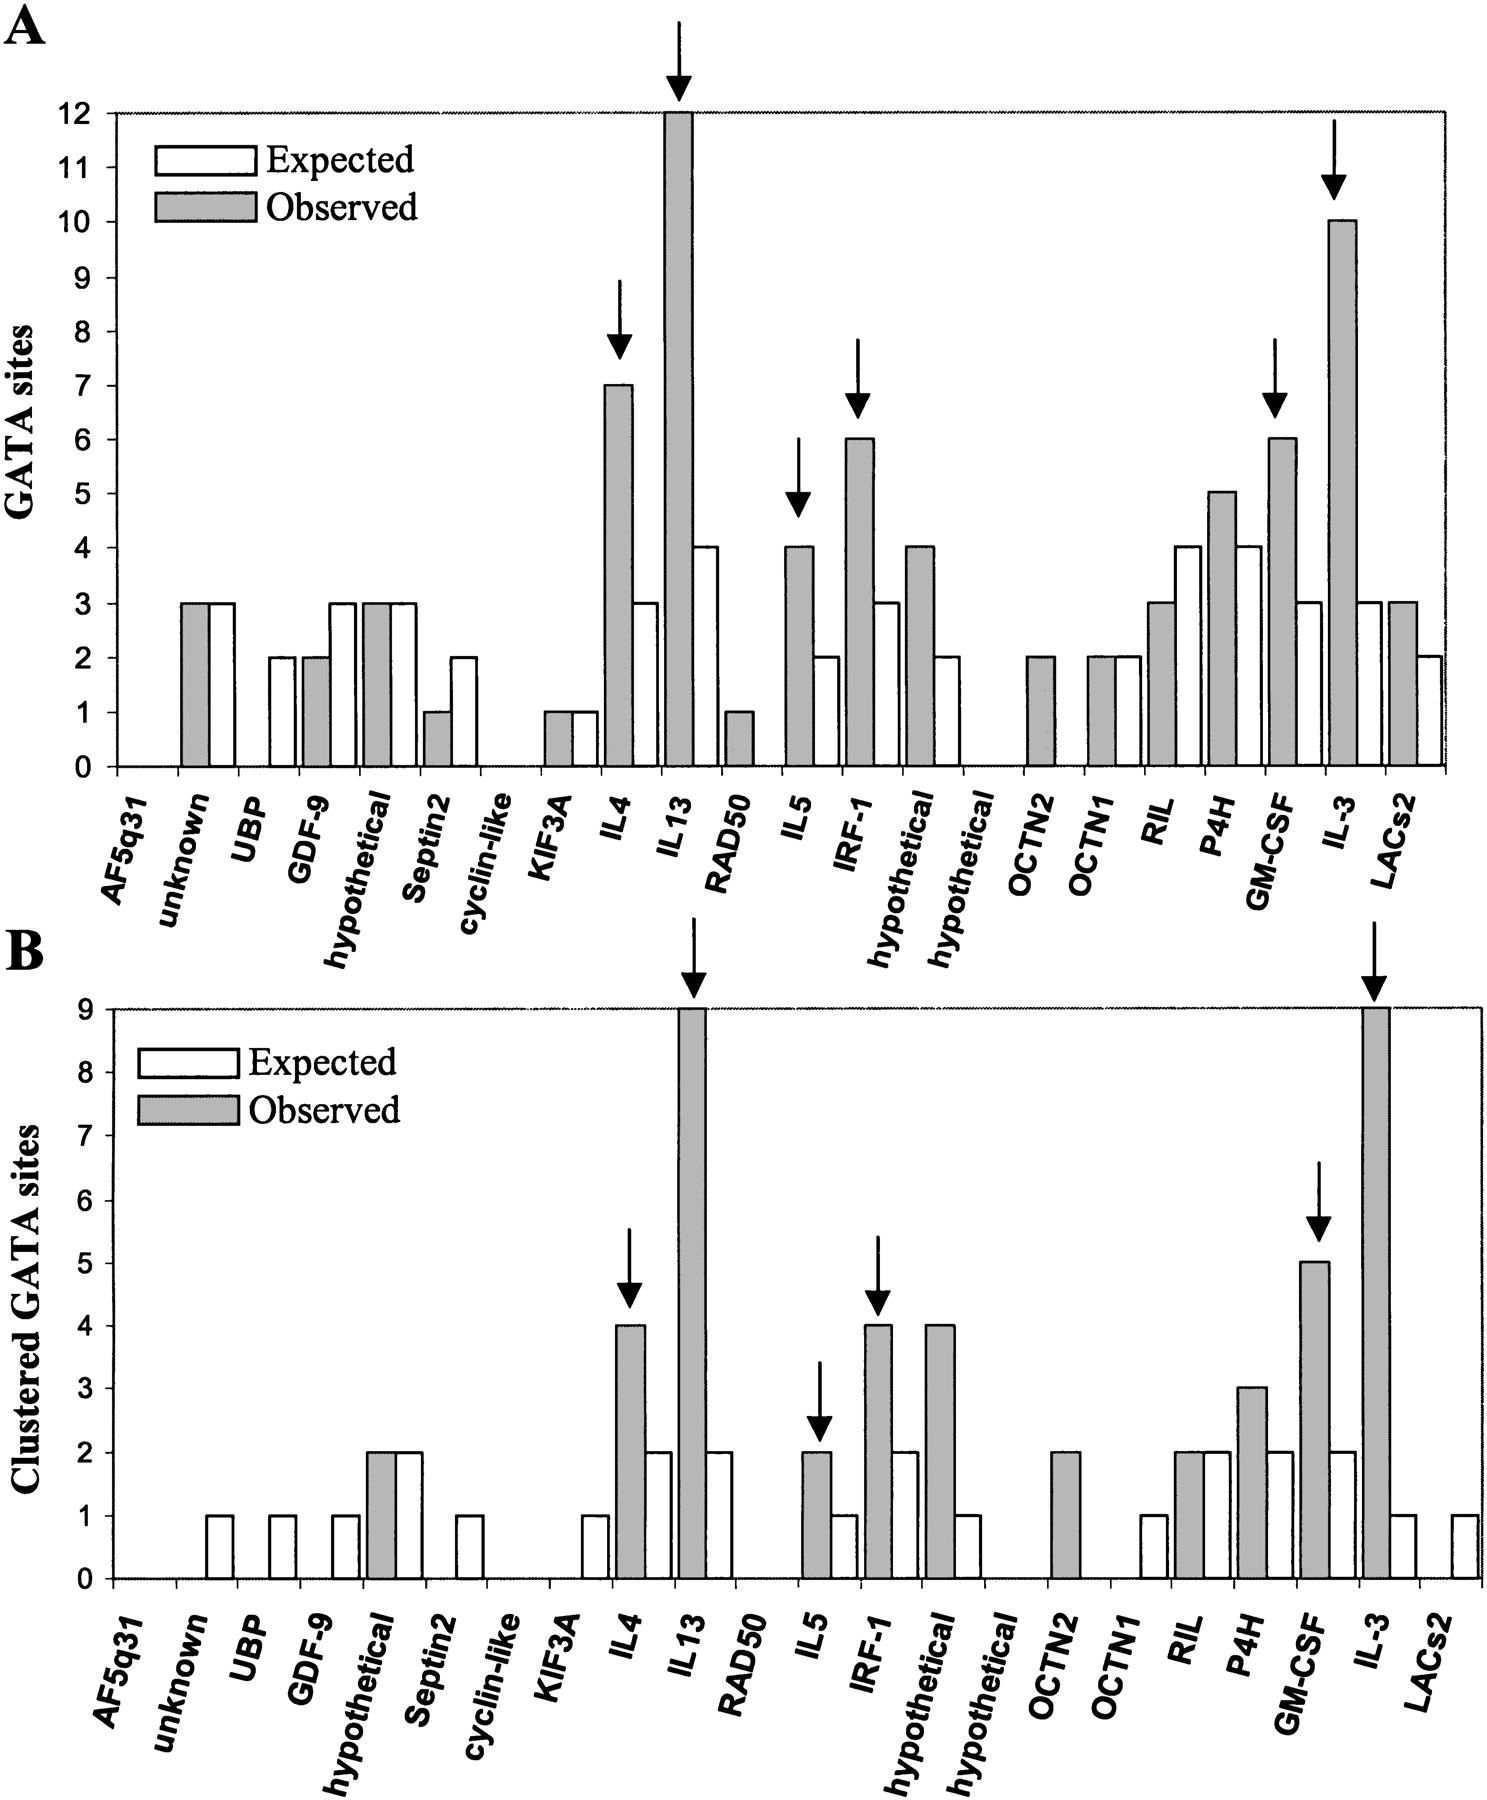
Figure 4.
Distribution of conserved GATA-3 binding sites across the 22 promoter regions (2 kb upstream of 5′UTR) of all annotated genes from the 1-Mb cytokine gene cluster (Hs5q31; Mm11). Cytokine genes are labeled by arrows, gray bars indicate observed GATA-3 sites, and open bars represent predicted GATA-3 sites as a result of random distribution. Random distribution was estimated on the basis of the frequency of GATA-3 sites across the 1-Mb human sequence and the DNA conservation of each promoter. (A), conserved individual GATA-3 sites. (B), conserved GATA-3 present in clusters (two or more conserved sites enclosed in a 60-bp DNA fragment).


