
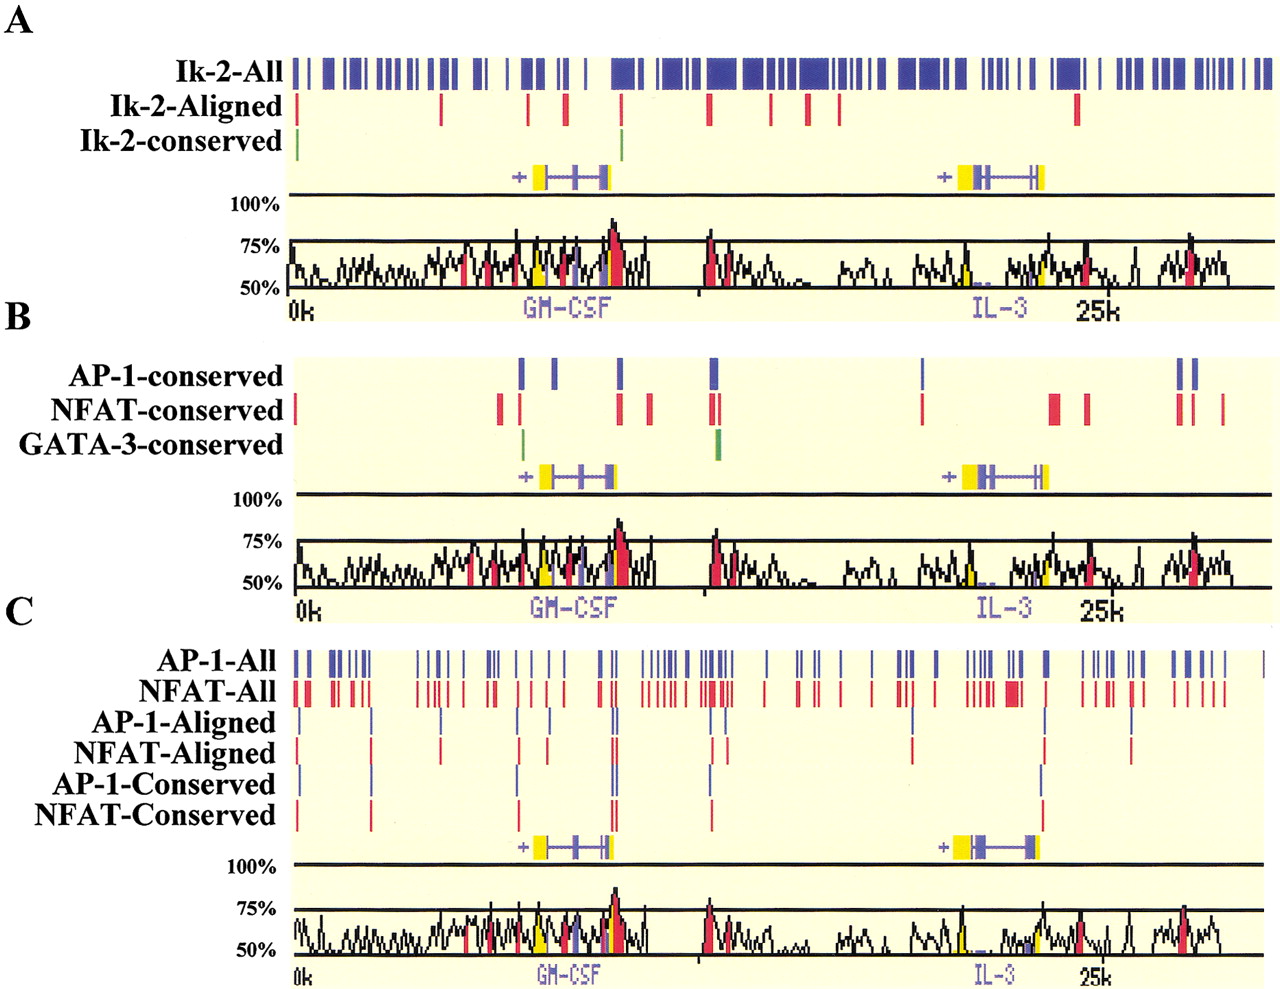
Visualizing rVISTA cluster analysis for a 25-kb region across the GM-CSF and IL-3 genomic interval. (A) Ikaros-2 TFBS clusters (two sites over 60-bp region). Ikaros-2 matches fitting the clustering criteria for the human sequence alone are depicted in blue, aligned clusters in red, and conserved clusters in green. (B) Multiclustering of individual sites can be performed by independently choosing the clustering criteria for each TF. AP-1 (blue), NFAT (red), and GATA-3 (green) clusters (two sites over 100 bp) of conserved TFBSs are illustrated. (C) Combinatorial clustering of TFBS. By use of the clustering criteria of 1 NFAT and 1 AP-1 across a 60-bp DNA fragment, the rVISTAprogram identifies all the AP-1 (blue) and NFAT (red) paired and displays them as tickmarks. This clustering module can be applied to the three data sets allowing the visualization of clusters in the reference sequence, among the aligned sites, and the conserved sites.


