
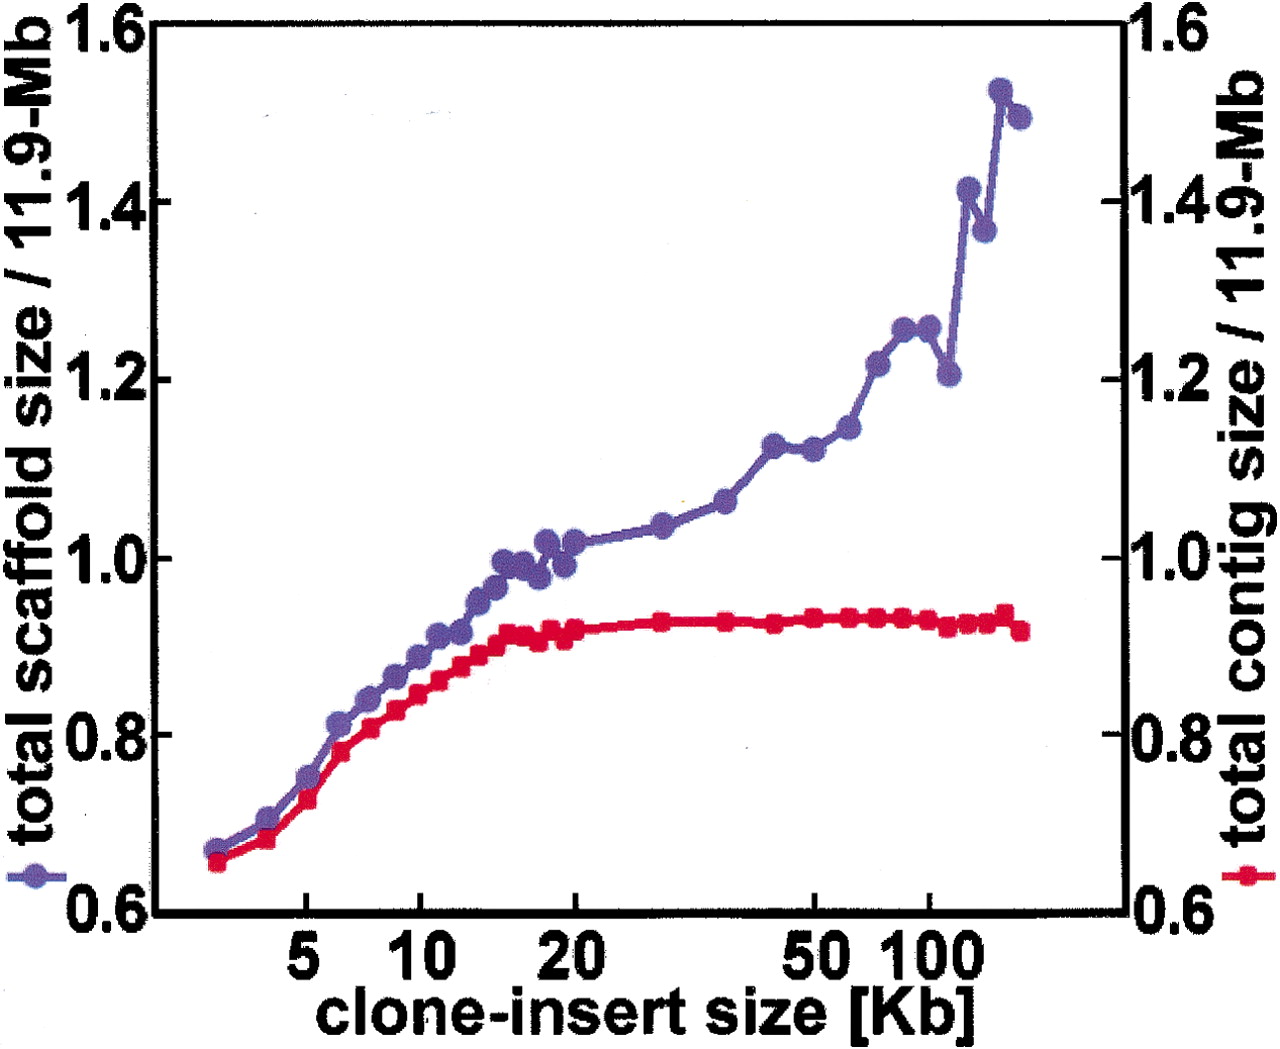
Optimization of clone-insert size. This analysis is based on the human 4× + 2× data set. The first 4× of data has a 2-kb clone-insert size, and the final 2× has the clone-insert sizes indicated here. Scaffold size is the sum of the contigs, plus the estimated gaps between these contigs. For this figure, we plot only the scaffolds with two or more contigs, sum over all the scaffolds, and then divide by 11.9 Mb. Similarly, we plot only contigs that are part of such a scaffold, sum over all the scaffolds, and again divide by 11.9 Mb. As the clone-insert sizes increase, more of the target region is subsumed. After 15 kb, however, the total contig size stops growing, but the total scaffold size does not. This can be explained by the interleaving scaffold problem of Fig. 3d.


