
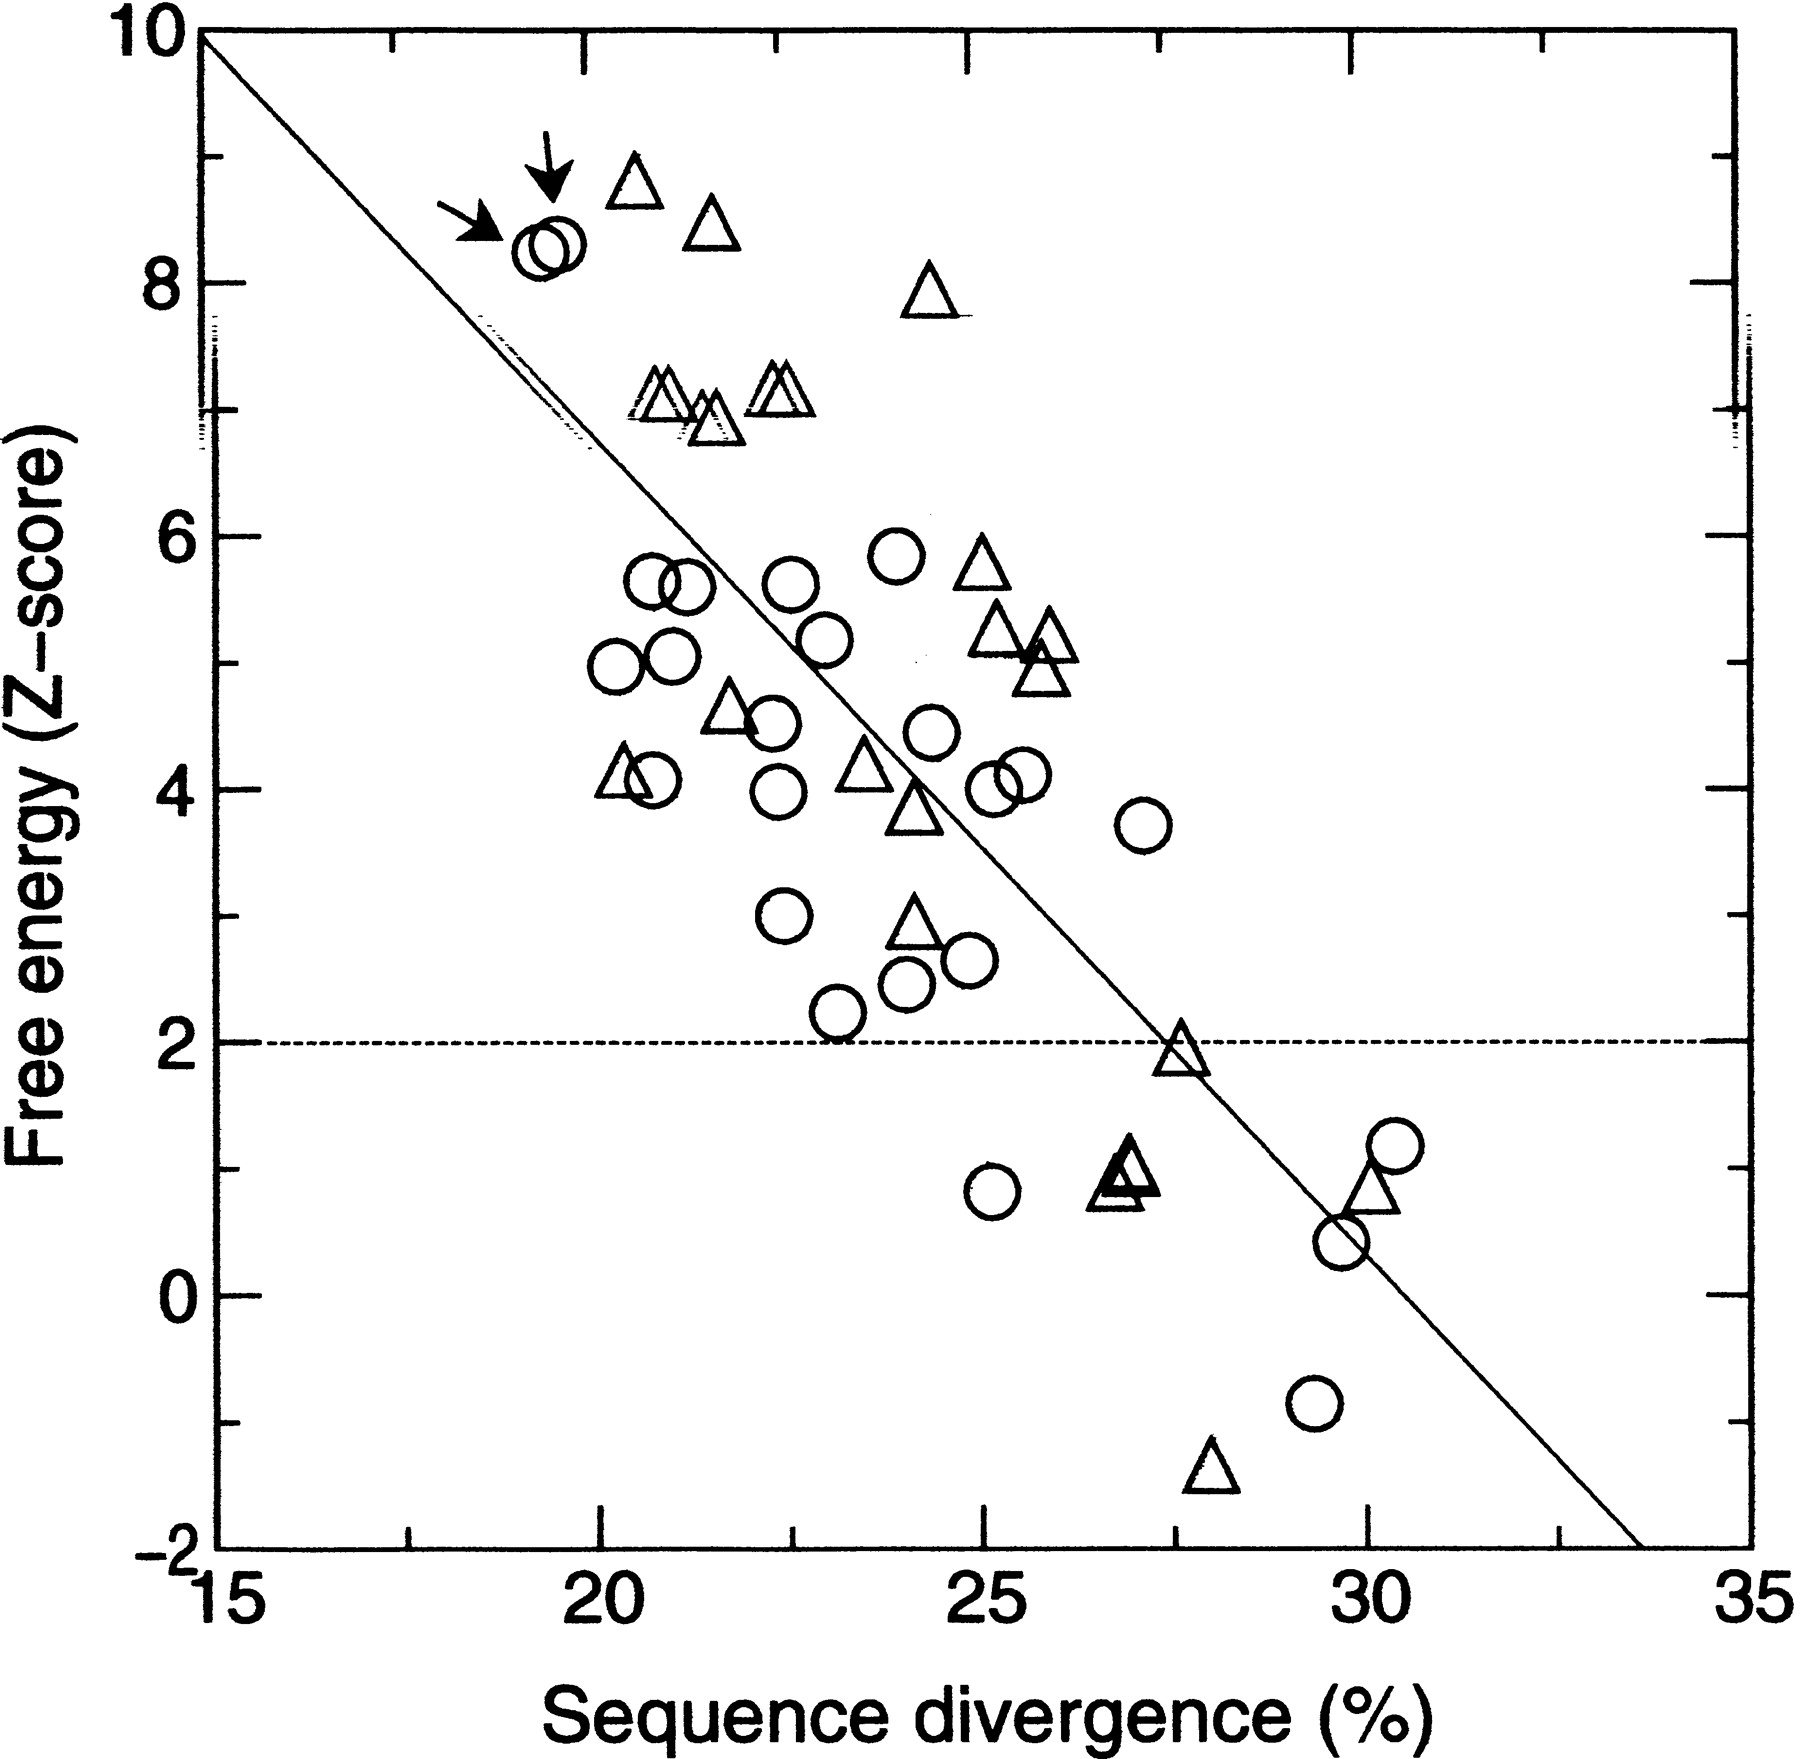
Figure 5.
The minimum free energy of the predicted RNA secondary structures of the RPE-1 plotted against sequence divergence. The energy values are scaled into Z-score. Circles correspond to the repeats in coding regions. Triangles correspond to the repeats in noncoding regions. The arrows point to the two most similar sequences.


