

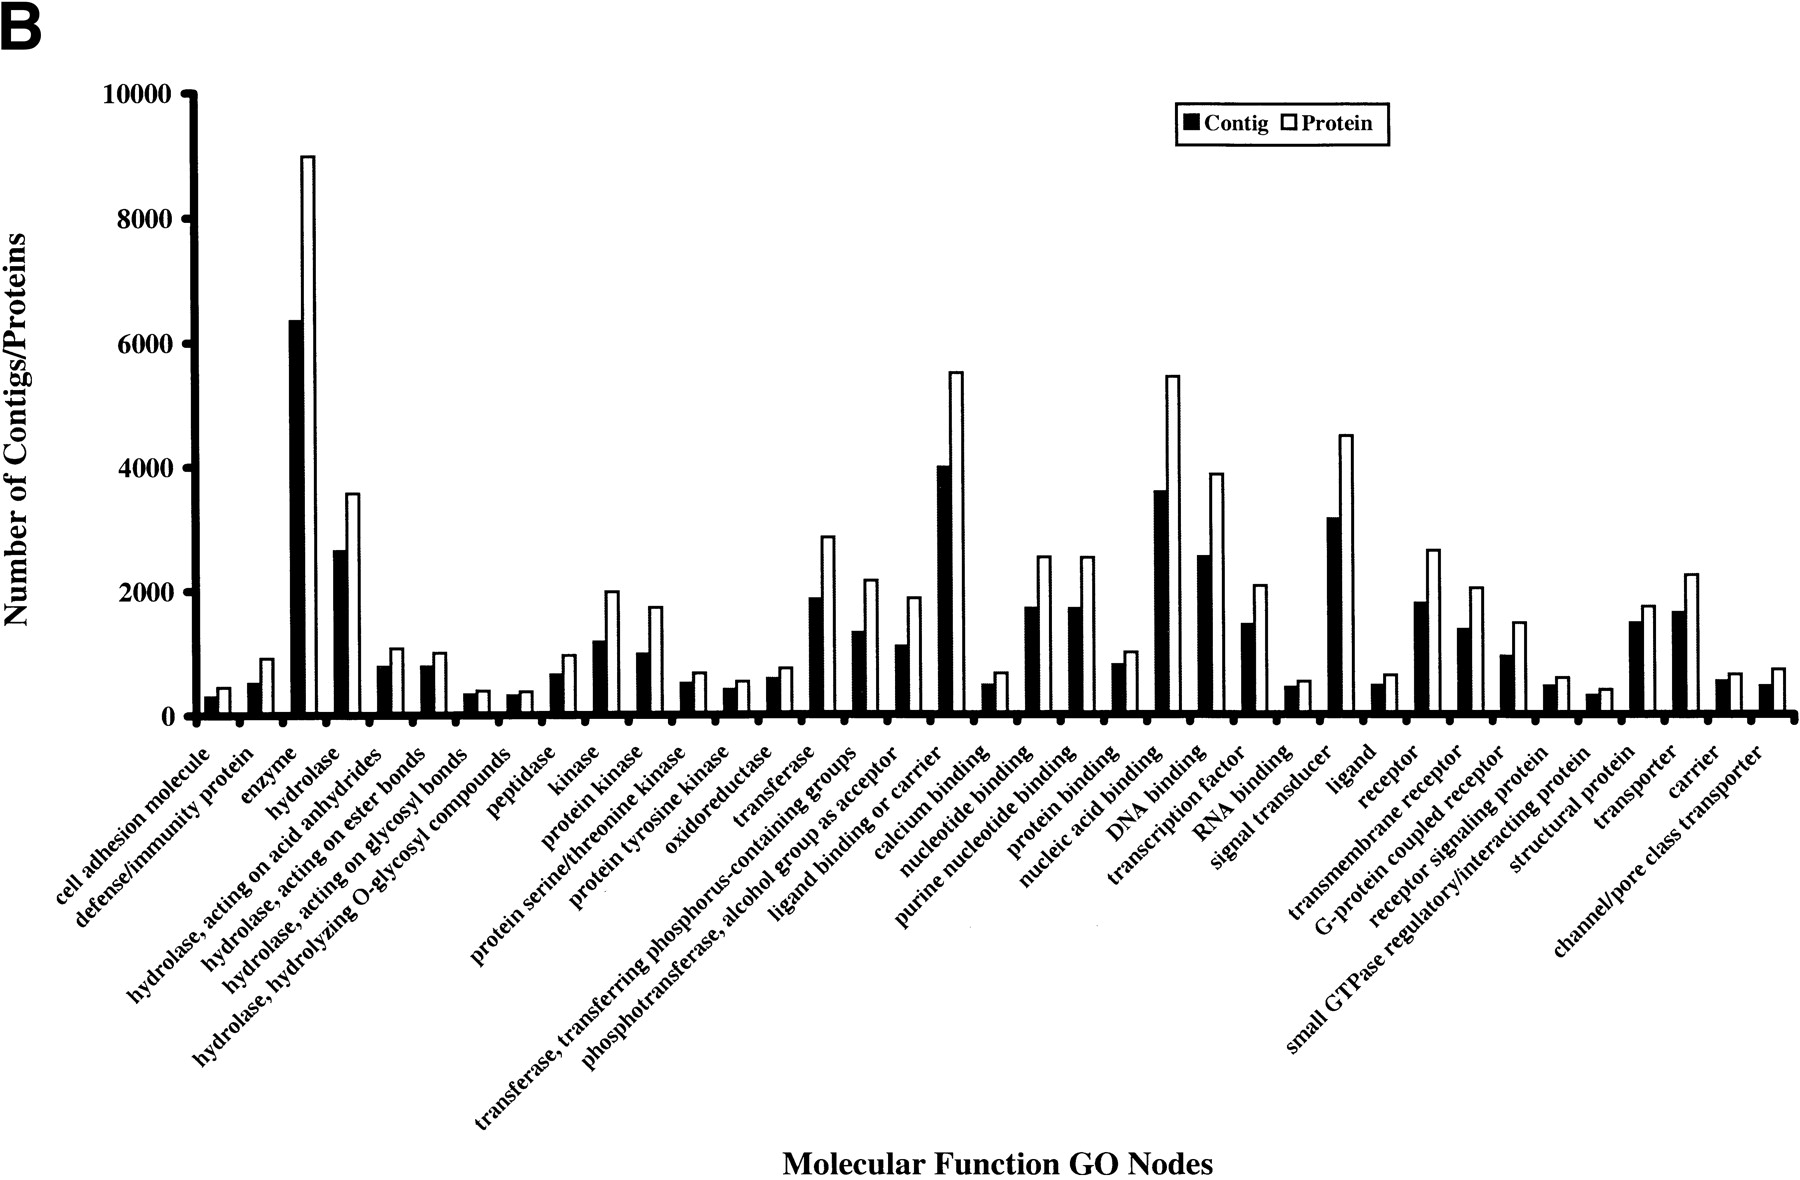
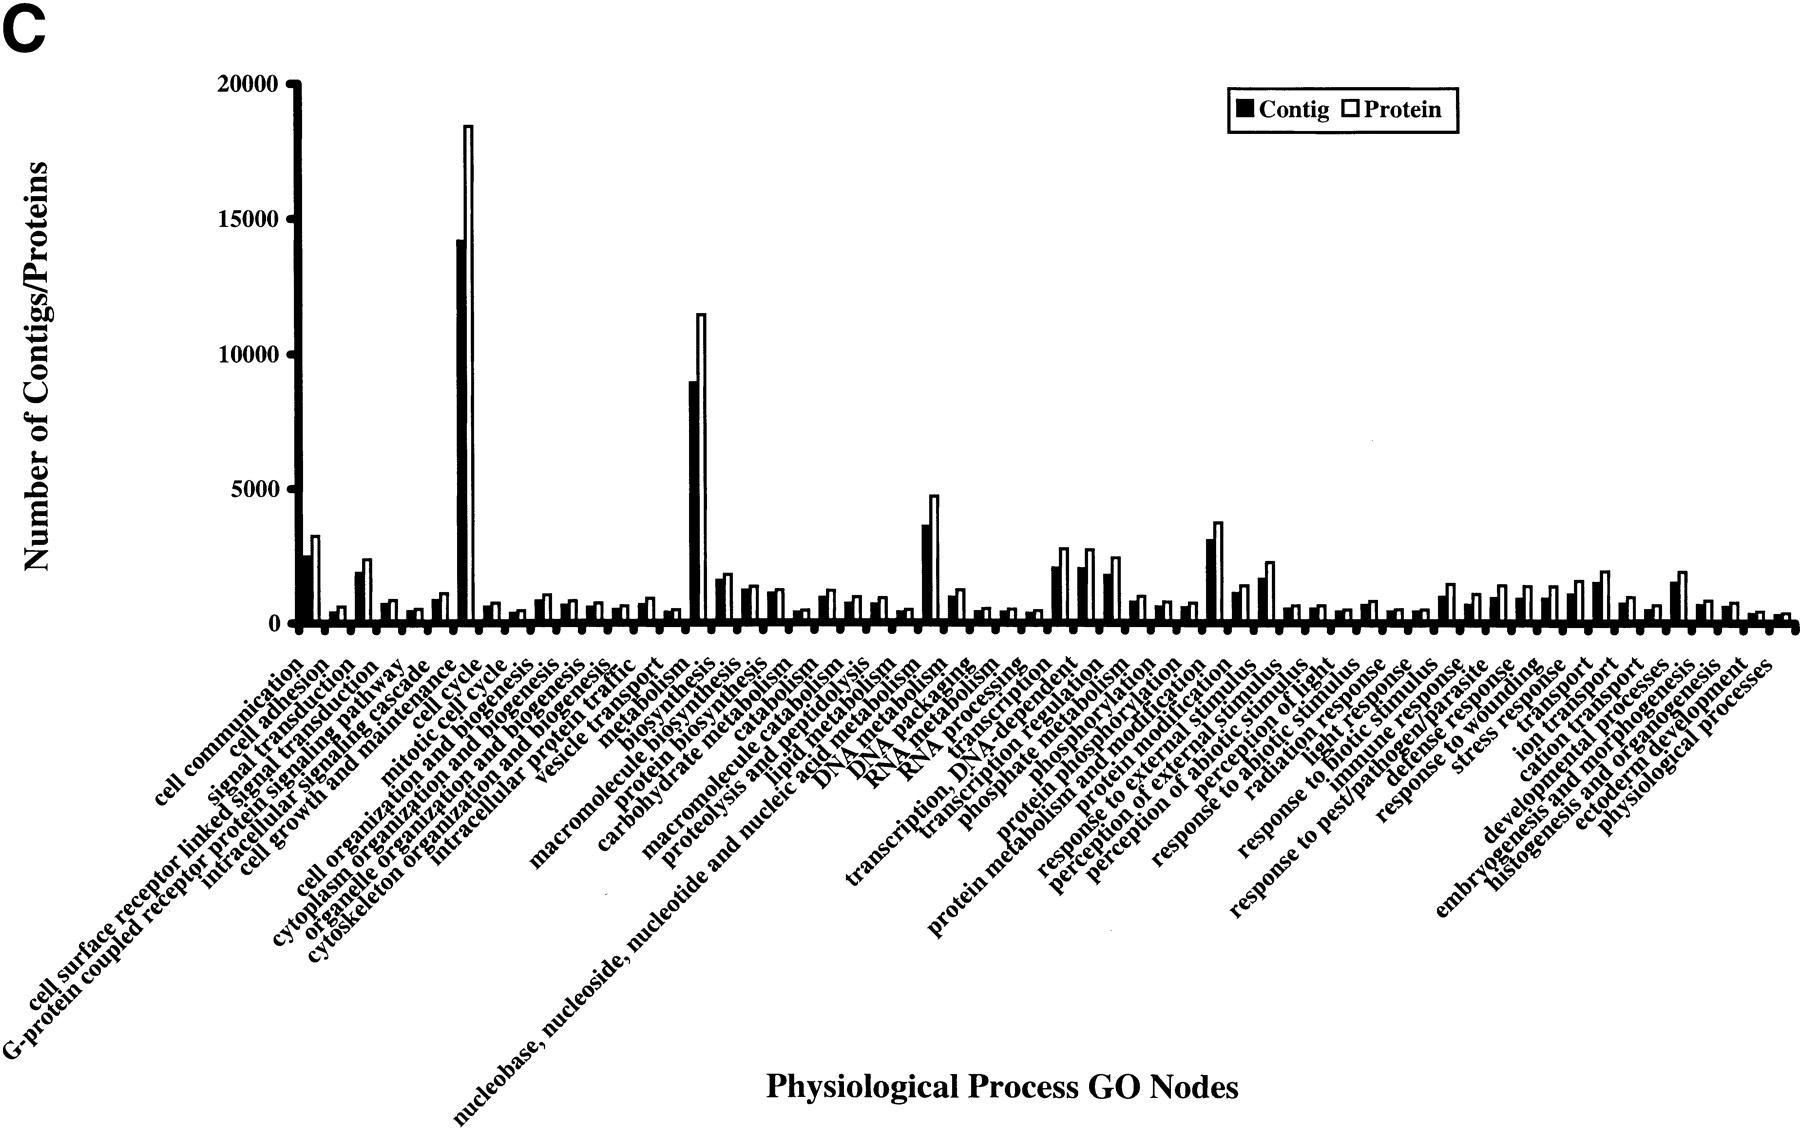
Figure 4.
Histograms show the number of proteins and contigs from Ensembl version 1.0.0 in the major nodes in three GO categories: cellular component (A), molecular function (B), and biological process (C). The number of any particular node represents the sum of the number of proteins annotated with this node and that with all children nodes. The sum of all numbers may exceed the total number of proteins or the total numbers of contigs because the annotations of some nodes, which are the children of several higher nodes, are counted multiple times.


